Impact communication
& ESG through interactive maps
We help corporates and sponsors bring transparency, interactivity, storytelling and innovation to their ESG communication.


Trust and storytelling brought to your climate communication
Show your contribution to nature-based projects in a transparent way through:
- Satellite images: with Mapbox, Bing, ESRI and NICFI latest images
- Project timeline: to show the impact of the project you support over time.
- Data Layers: To back-up your communication with trusted scientific data.
Embed your map on your website
Use the embedded map on your website to enrich your communication and show the impact of your sponsorships.
A creative way to build engaging marketing campaigns
Show your clients the real impact of their contribution assigning a piece of land or a tree to each one of their purchase.
Building engagement through impact marketing with trusted data and interactive maps.
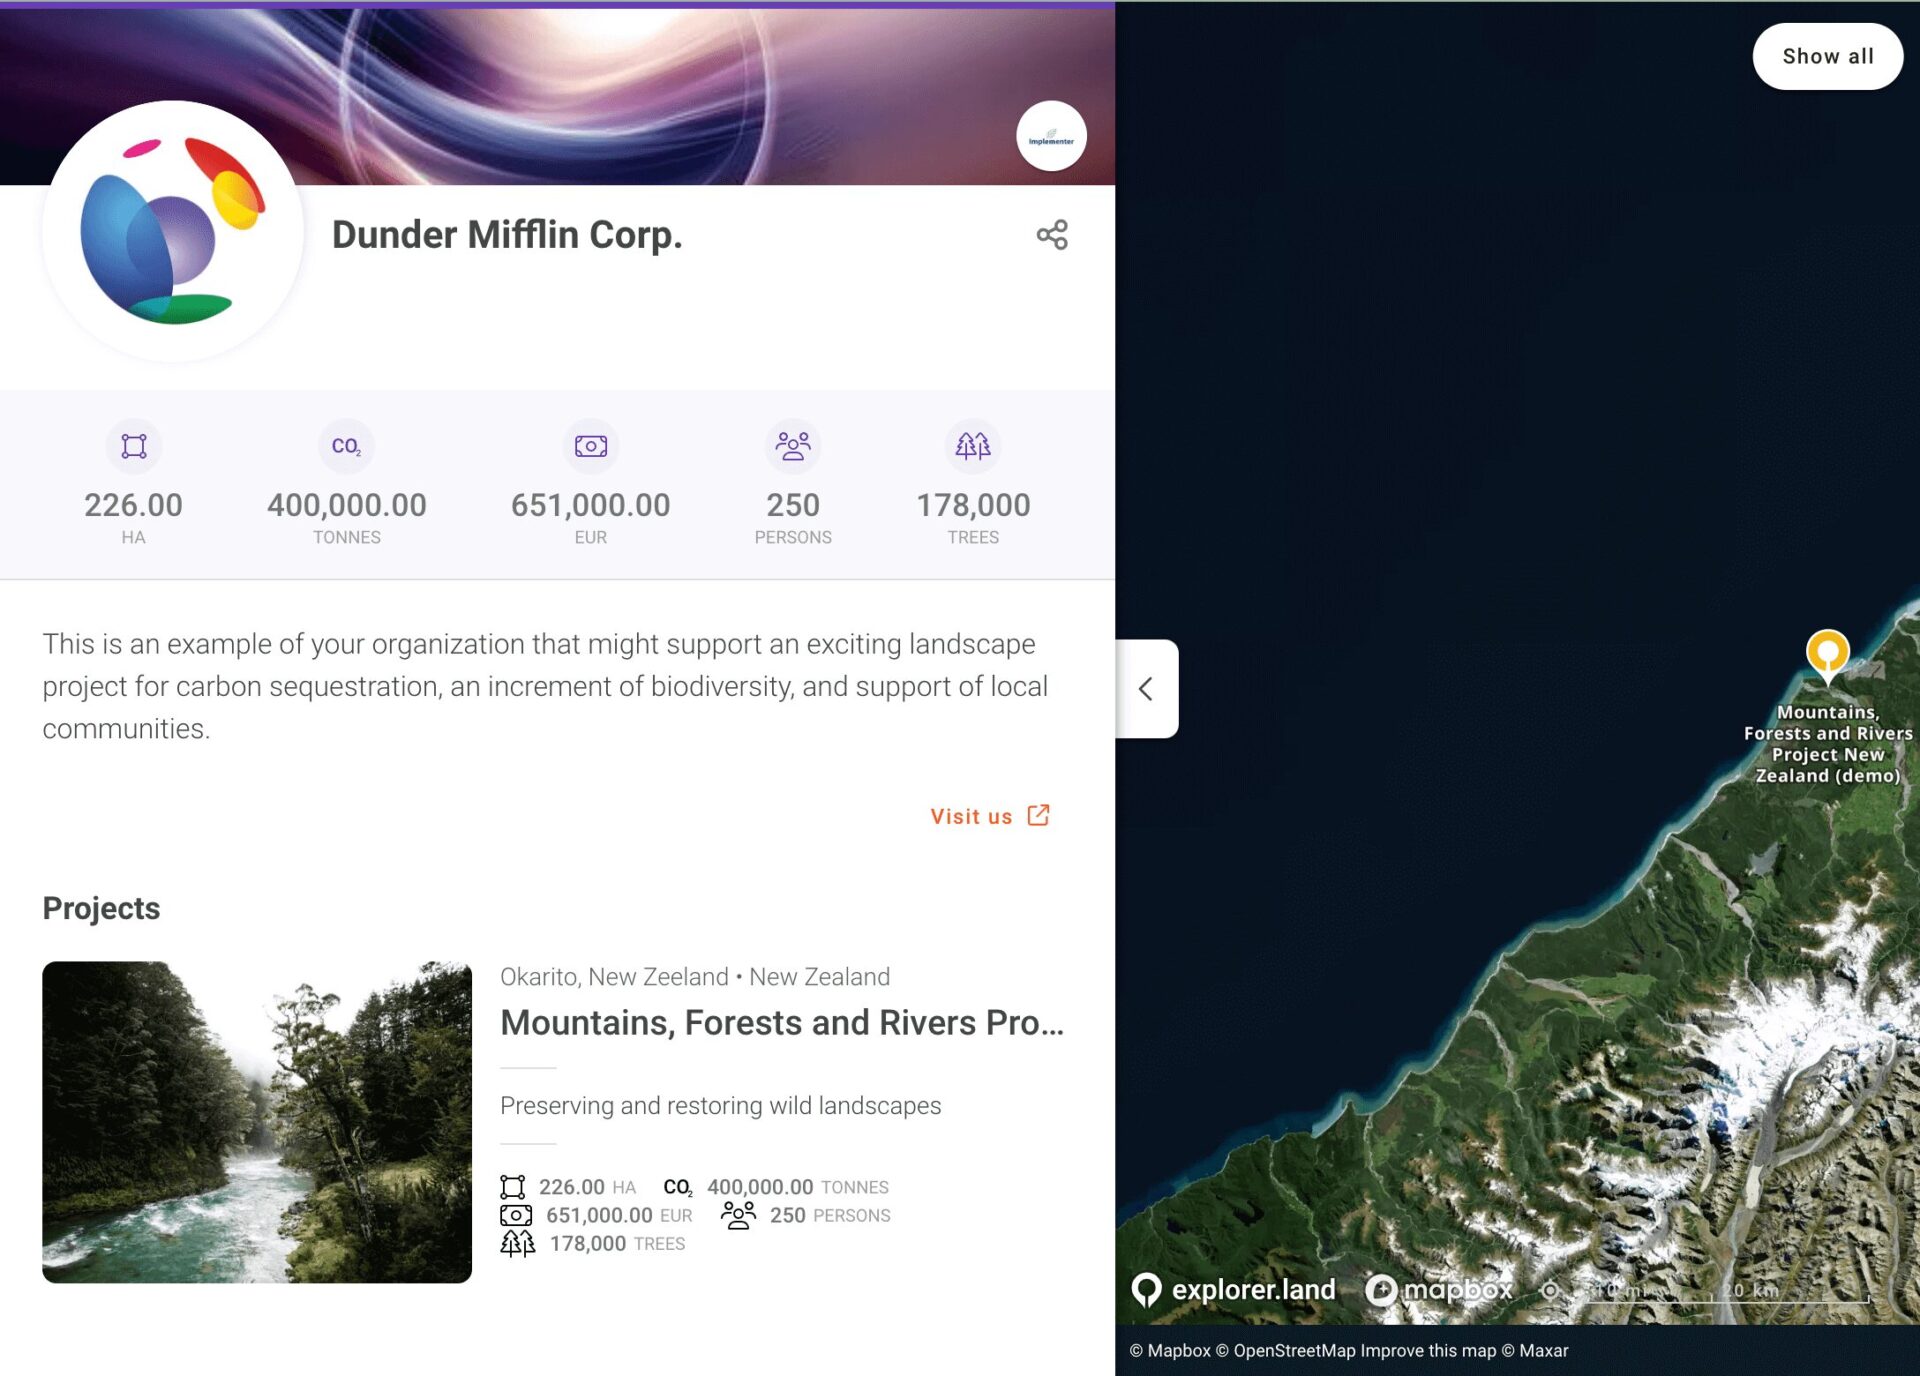
Your dedicated Sponsor profile
When you sponsor nature-based projects, it’s not always easy to have visibility of where and how your money is spent and to show the impact of your contribution.
Thanks to our dedicated sponsor profiles and 3rd-party data integrations, you can now follow and share your impact with full transparency.
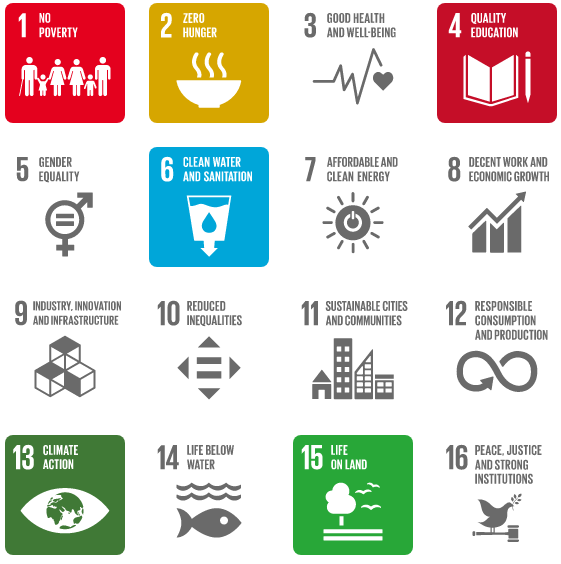
United Nations Sustainable Development Goals
Projects can select one of several United Nations Sustainable Development Goals (SDGs) and describe how they contribute to the UN Goals and Targets.
With this feature, landscape projects have an additional mode to express and document goals and impact, systematically and transparently.
Receive tips in your mailbox
“A one-stop shop for curated projects all nature-related”
Tullia Baldassarri
Communication & Marketing Manager at Interholco
Trusted by +2,000 users around the world

Thanks Alexander Watson, we love using explorer.land maps for storytelling and transparency. It's an excellent tool that gives our clients an opportunity to really dive into our projects 🌲

Since engagement in explorer.land, potential clients, and partners are contacting us. It is a wonderful platform with a super-wide network of potential clients and partners. It has helped us a lot in moving forward with our ecosystem restoration activities. Not only because we can prove exactly what we are doing, but it has also put us in contact with various international clients and partners. The platform really works for us.

An important part of my role at Greenpop is to authentically and transparently communicate the impact of our work to our donors. explorer.land has helped me visually communicate our work. It has combined many of the goals we have for project communications into an easy-to-use platform. The service we have received from the explorer.land team has been exceptional.

OpenForests’ web map has been a fantastic tool to visualize our reforestation project El Silencio for fundraising.

I really love the mobile UI! I know that challenge from Terrastories, and I think you’ve done an excellent job approaching it. I played around with the page and map, and as before, experienced that everything is as intuitive as I expect it to be. Really great stuff!
With the multistakeholder module we could bring all our members and their projects onto one map. In fact, the prospects of using the map-based membership platform is more promising than originally anticipated. We're looking forward to develop the tool together with OpenForests to also meet future, additional demands. The official launch of the map with a video and an article published by Mongabay turned out to resonate very well with our membership as well as outside organisations (e.g., the UN Decade on Ecosystem Restoration) and media.
Restoration and conservation initiatives (e.g., projects or programs of NGOs, social enterprises, private companies, or local to national governments) use the platform to document and display their progress and impact. They use explorer.land to tell their impact story transparently, to immerse stakeholders in place, and to engage with supporters.
Funders, purpose-driven businesses, sustainable brands, and buyers of forest goods and services (including carbon) use the platform to find transparent and interesting projects to support and collaborate with.
For projects:
- Manage info & communicate story
- Immerse audience with 3D views
- Integrate high-resolution geo images
- Demonstrate transparency
- Gain visibility: potential supporters find you
- Promote forest goods & services
For funders & supporters
- Find projects with search criteria
- Explore transparent projects
- Engage directly
- Add your organizational profile
- Communicate your support
- Grow the restoration movement
explorer.land makes all project stakeholders visible. Show project locations and organizations as well as communities that are active on the ground. Furthermore, each project can show associated organizations e.g. multistakeholder constellations from science, standards, private market actors, funders, donors and investors.
Projects published and listed on explorer.land increase their visibility and are easily found by funders. Visibility can be increased by using the social sharing function and the call-to-action button to guide the prospects to your fundraising materials.
Furthermore, the map-based project presentation serves as exciting and beautiful communication material, that allows for presenting remote projects in-depth during fundraising events or in one-to-one meetings and video calls.
There are various functions to document and monitor project activities:
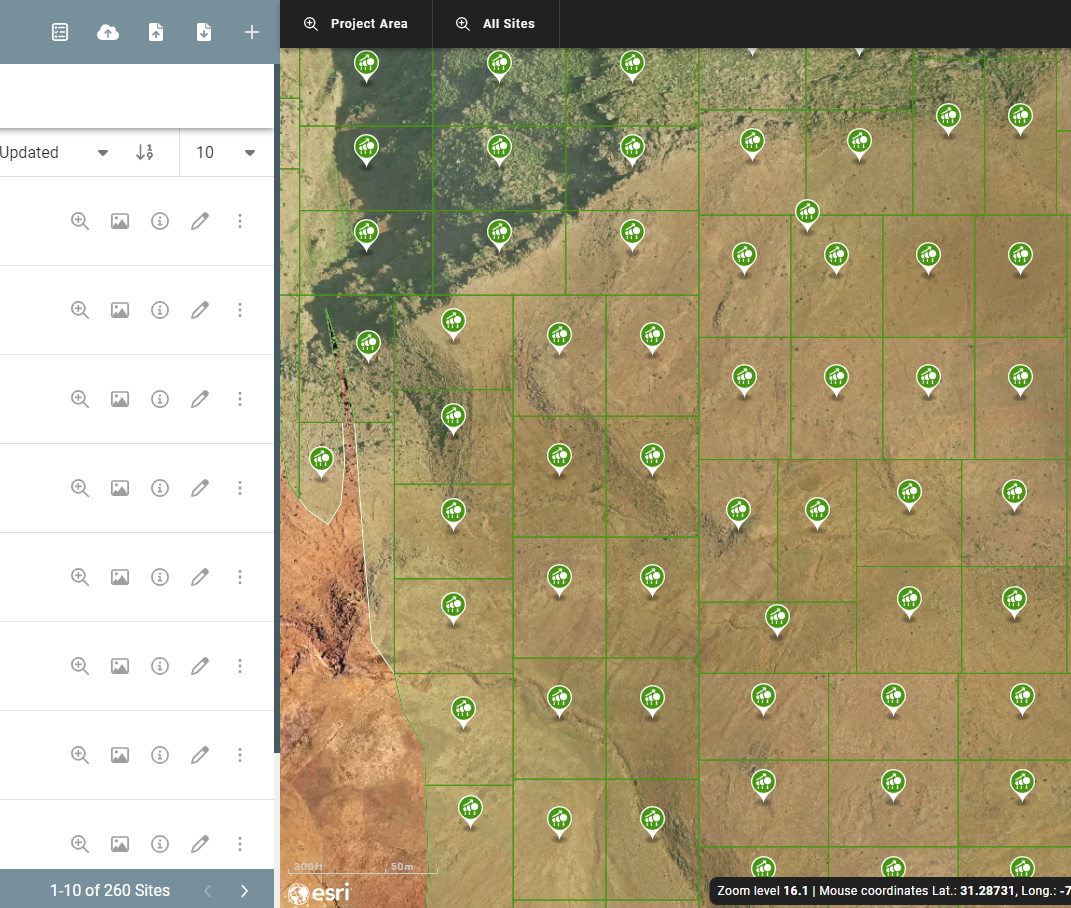
- show the exact geolocation of a project, indicate land use, and integrate attribute data to every location,
- exactly place geolocated news posts with a time stamp on top of your project map to describe and document any field activity or observation,
- integrate high-resolution drone or satellite imagery and show before and after of e.g. planting activities,
- activate Thematic Layers to show the impact via a growing number of global data layers such as deforestation monitoring.
