Features

An overview of what can be done

Description of the most important features.

Find and evaluate projects

Find and list projects seeking funding

Discover opportunities to fund impactful projects, whether it's through investments, sponsorships, donations, or the acquisition of carbon and biodiversity credits.

Image link

Search projects

Explore the map or filter by search categories to find inspiring conservation and restoration projects to engage with or support. Search categories include project type (e.g., agroforestry, conservation, restoration), goods produced (e.g., coffee, timber, herbs), country of project, and participating organizations.

Image link

Explore project content

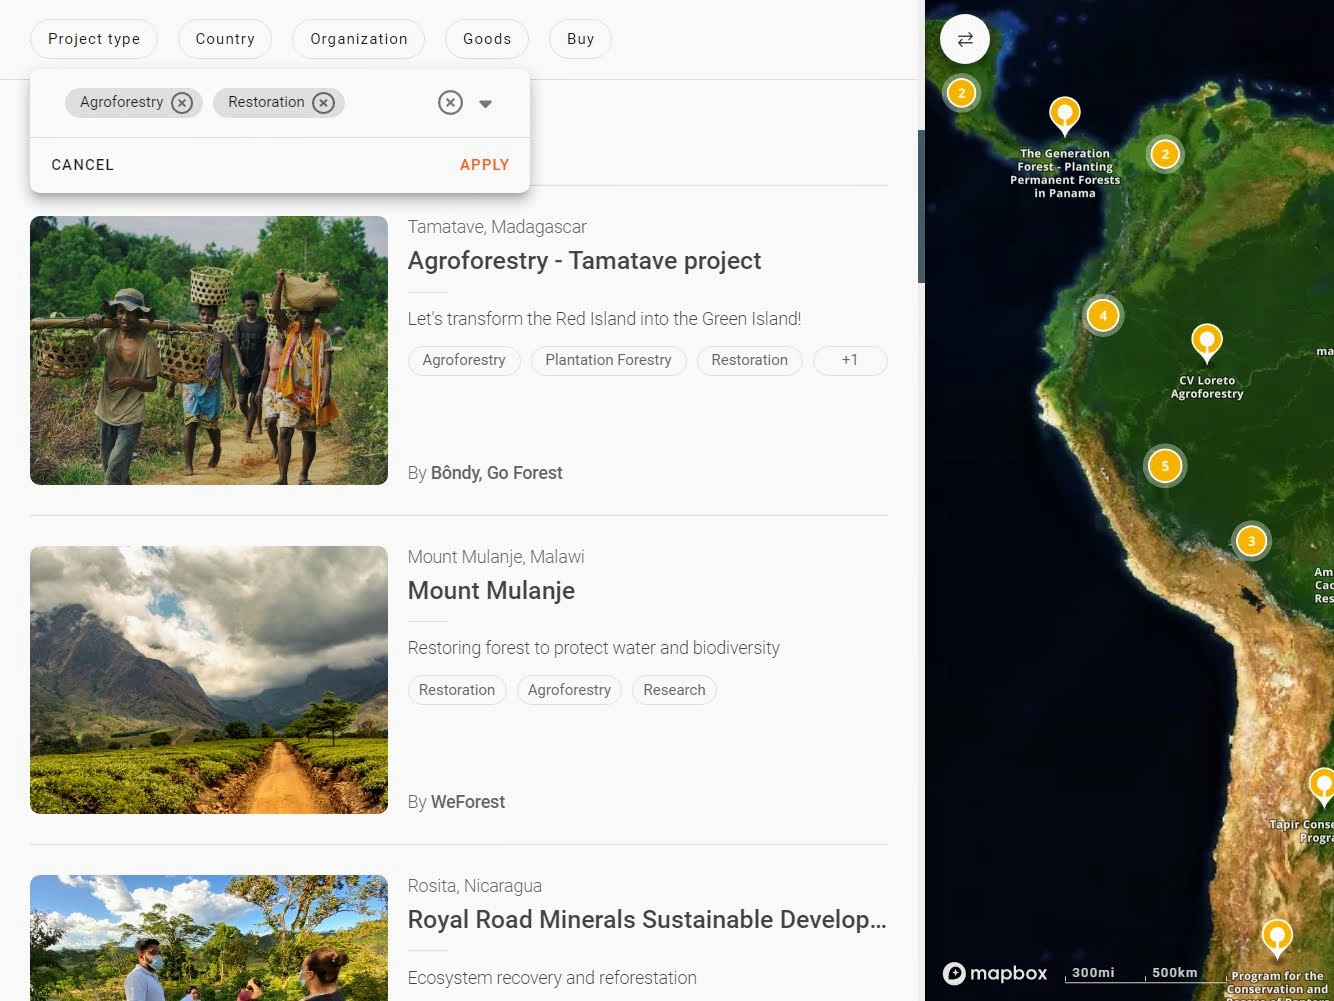
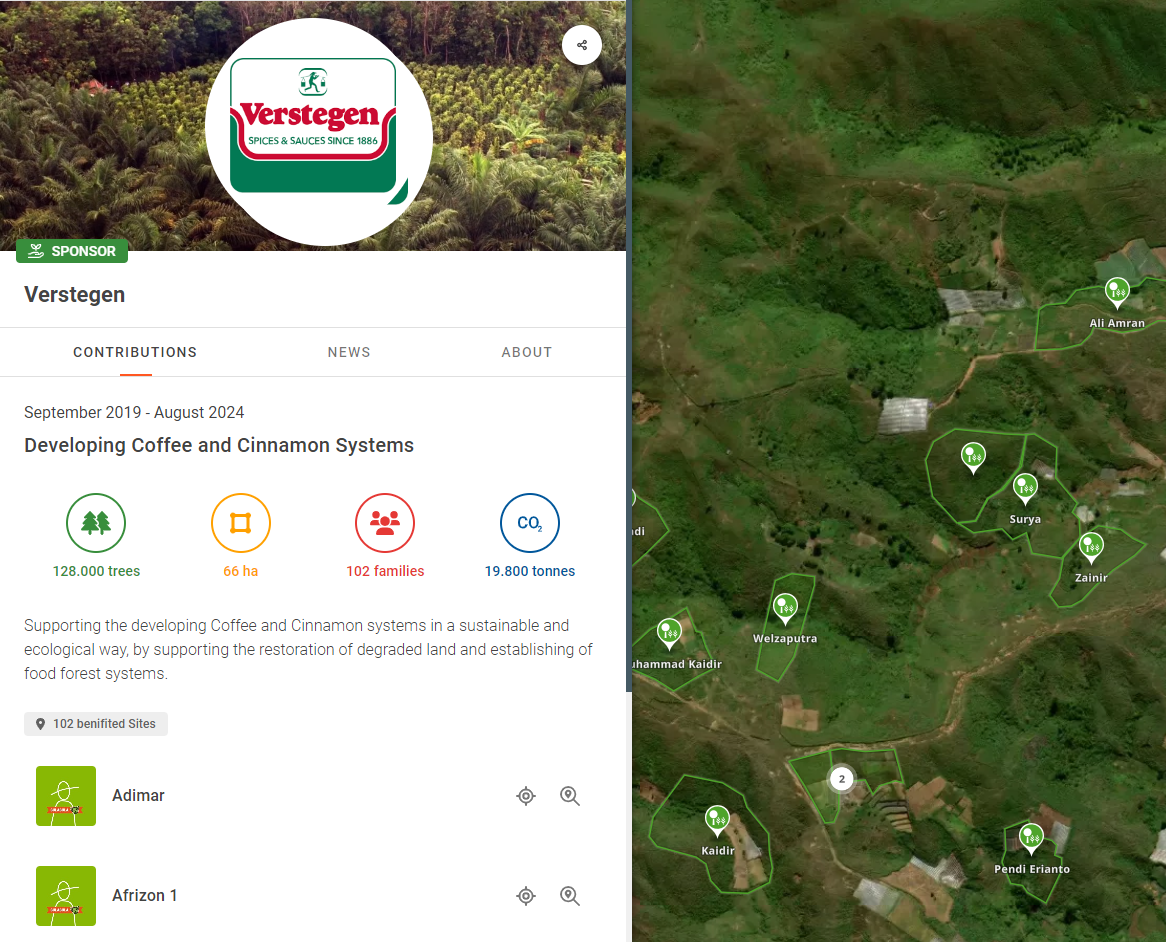
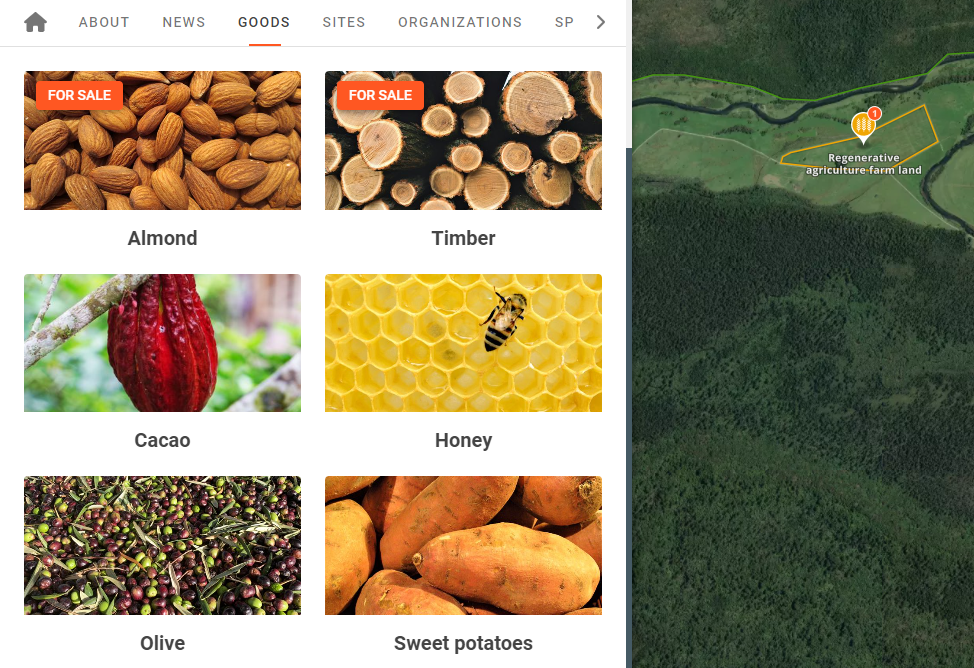
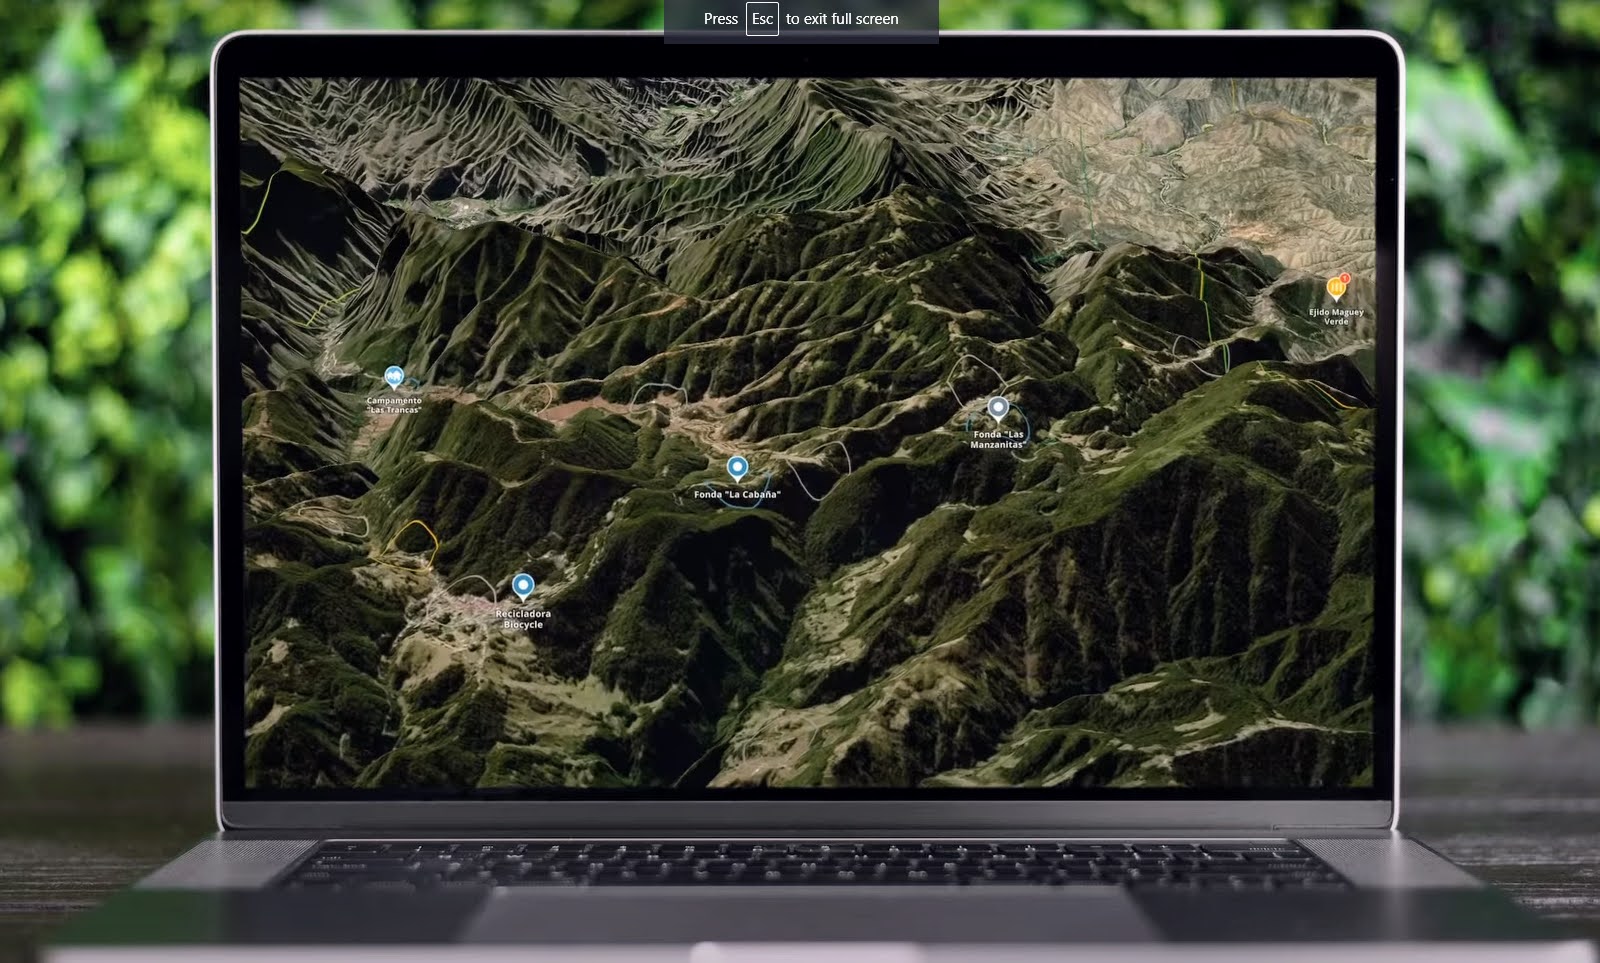
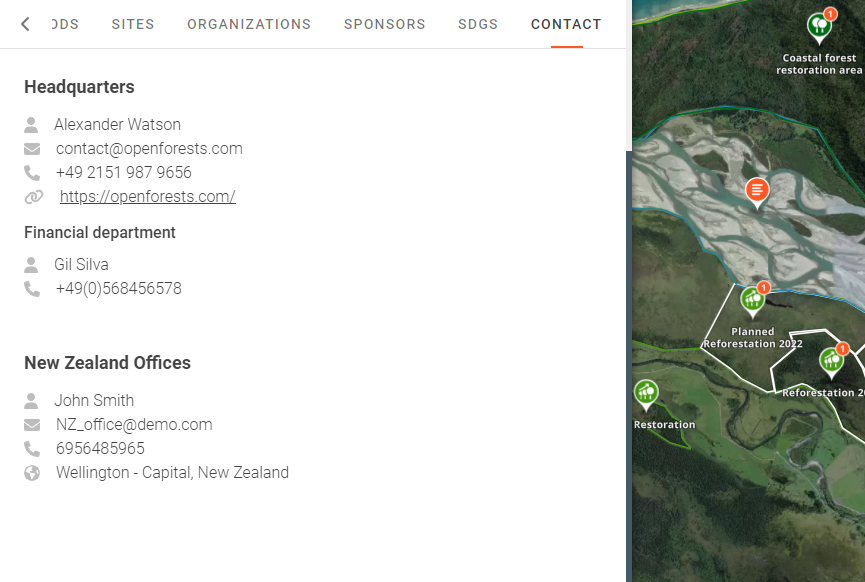
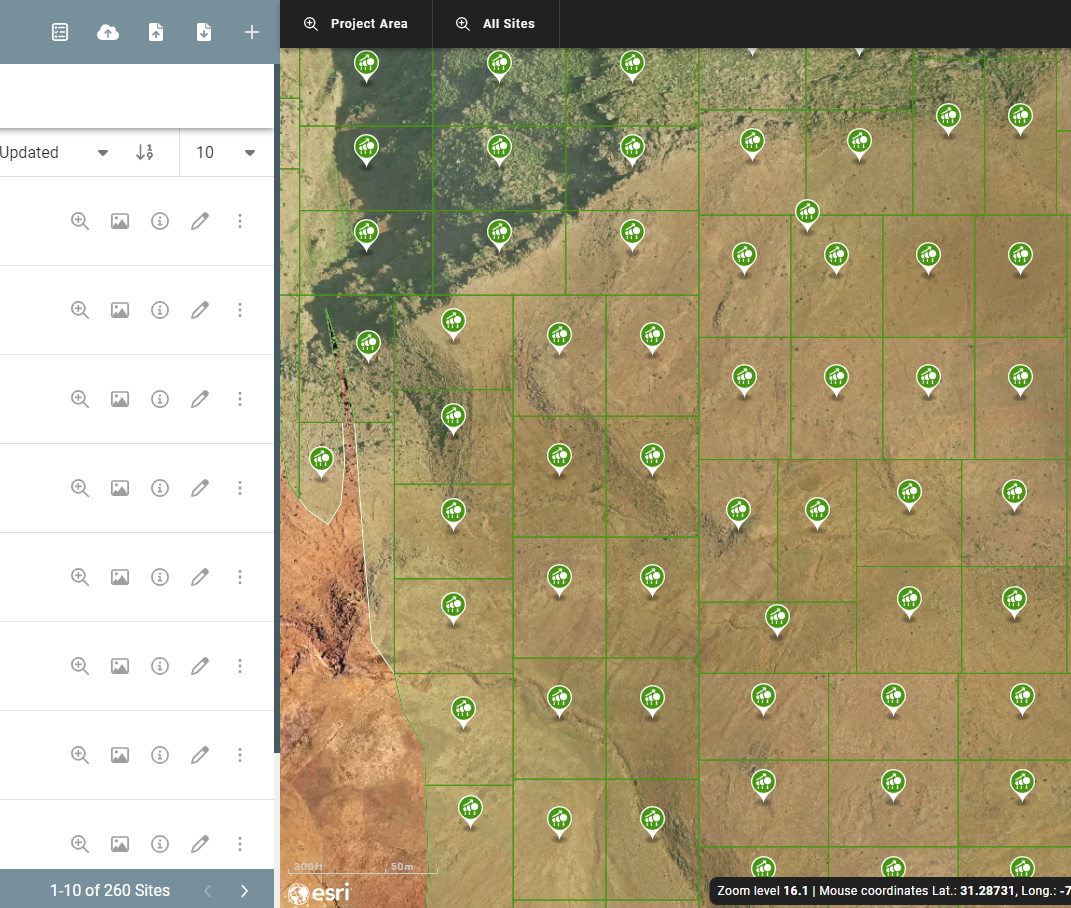
Content in project presentations is geo-located, i.e., dynamically connected to specific sites on the map. Content can be structured and viewed via the tabs menu in each project presentation: Home, About, News, Sites, Partners, Sponsors, SDGs, Goods, Contact.

Thematic data layers

A growing library of global data layers such as deforestation, forest fragmentation, tree cover, soil carbon, and tree biomass density can be selected to show the context and impact of projects.

Satellite timeline

Monthly satellite-based timeline for the global south. Show the change and impact within a landscape on high-resolution satellite imagery.

Forest loss analysis

Analyze the forest loss globally. Track annual forest loss starting in 2021.

Build profiles and maps

Projects & organizations

Create project and organization profiles. Multiple organizations (e.g., project lead, research partner, distribution partner) can be linked to each project and each project site (and vice versa). Each organization profile shows all the projects an organization is involved in on the interactive map, as well as a description of the organization and contact details.

Image link

Map-building

Upload or draw your geolocation. Maps can be styled with colored polygons and icons, which correspond to specific land use classifications such as conservation, agroforestry, and reforestation.

Geodata import & synchronisation

Projects with existing geodatabases can import all geolocations with attributes. Geodata import can be synchronized to maintain updated project locations and descriptions.

Image link

Drone & satellite imagery

Show the “before” and “after” in context: display: how your project has developed over time. High-resolution satellite or drone imagery shows how trees have grown in space and time.

Communication and fundraising

Geolocated news posts

Create geolocated news posts by linking text and photos to sites on the map. Ground-truth your progress, impact, and engagement with stakeholders and manage your project’s communication from one place.

Mobile story mapping app

The Android story mapping app can be used to capture and upload geolocated news posts while being on the go. Offline synchronization allows story collection without internet access in remote locations.

Image link

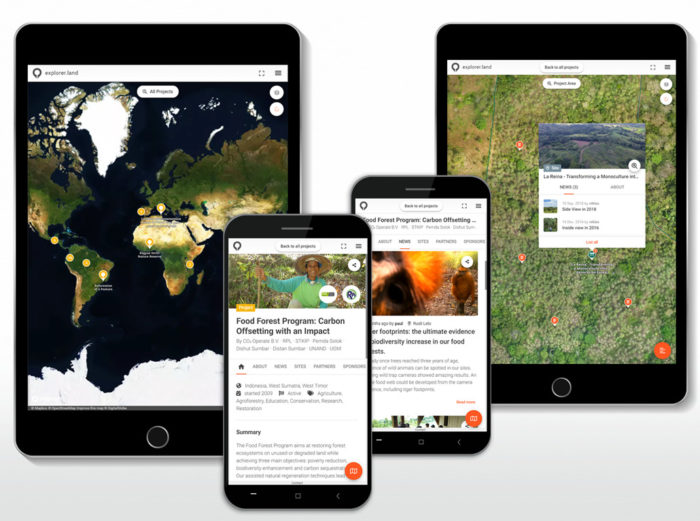
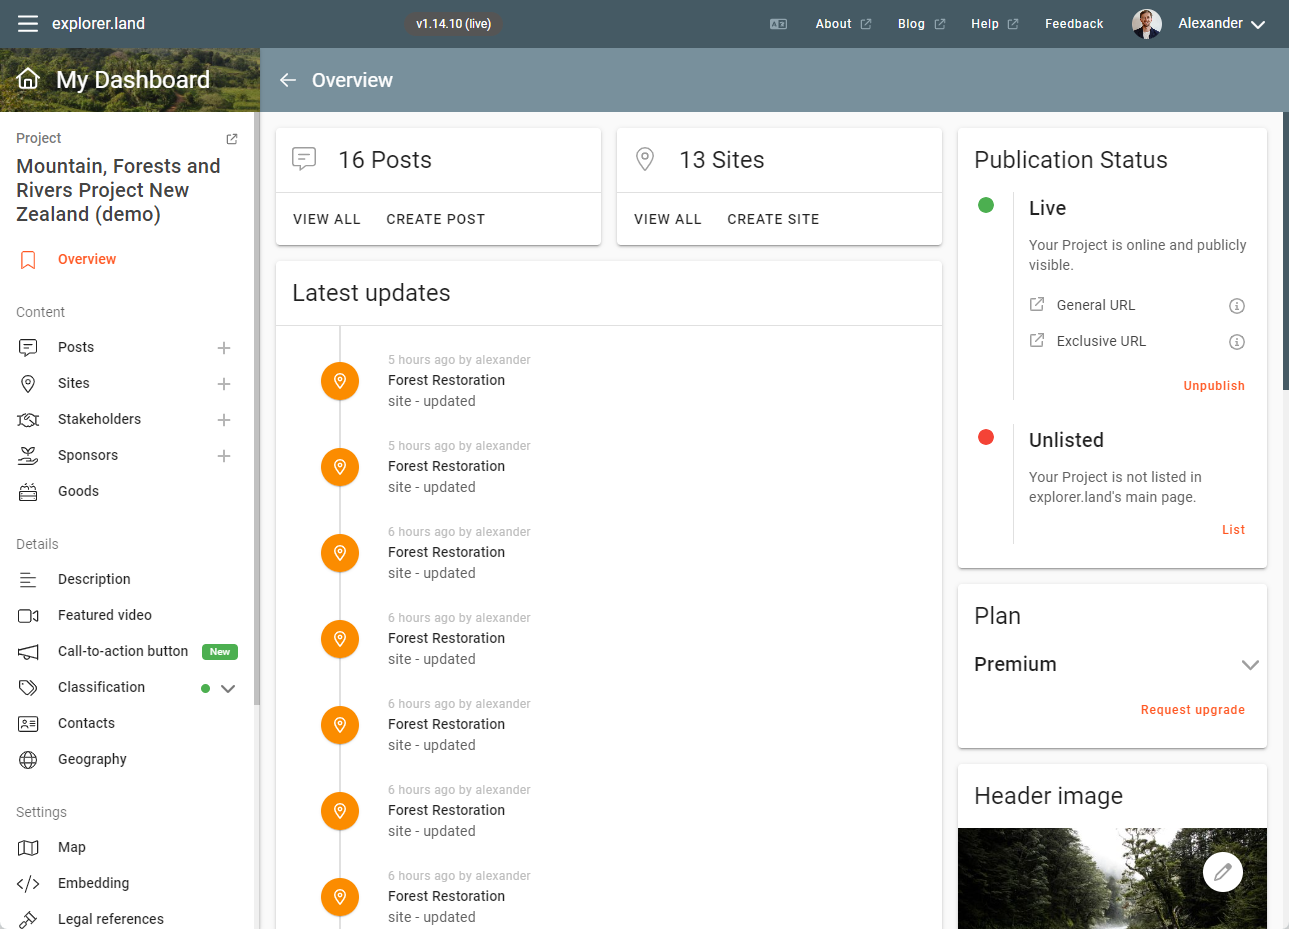
Social media sharing

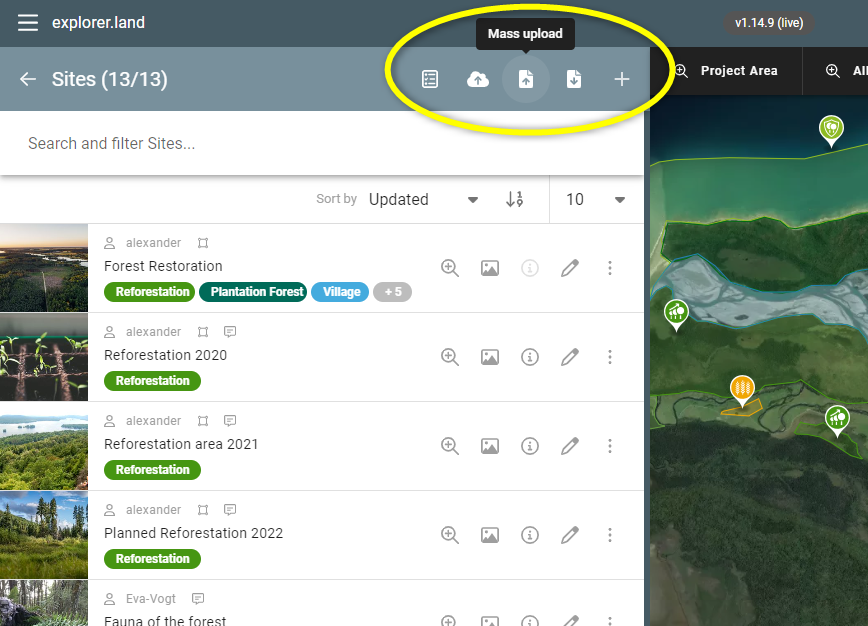
Consolidate your data and content in one place and share maps and geolocated news updates on social media.

Sponsor profiles

Give back to your financial supporters by building individual and branded sponsor maps. Sponsors receive authentic and transparent communication materials of high value showcasing sponsor engagement in landscape restoration and conservation.

Image link

Custom call-to-action button

Every project presentation can activate and configure a call-to-action button that can link to any online fundraising or volunteering information.

Video integration

Add a video to the homepage of your project or organizational profile on explorer.land to maximize engagement.

Embeddding

Embed your project maps, sponsor maps, and project overview portfolios via iframe into your website and other online presence.

Mobile UI

explorer.land project presentations work on all devices: desktop, tablet, and smartphone. Present your project on large conference screens, during video calls, or simply, on your smartphone.

Image link

Various

Sustainable Development Goals (SDGs)

Projects can select SDGs and describe how they contribute to the Goals and Targets. With this feature, landscape projects have an additional mode to express and document goals and impact, systematically and transparently.

Image link

Goods and sales

In addition to restoring and conserving ecosystems, many projects produce various forest and non-timber forest products. Projects can activate the “Goods” tab in their project presentation and also include their goods under the respective search category (explorer.land main menu). Projects can also activate the “For sale” advertisement and include their projects under the “Buy” search category.

Image link

3D project discovery

We experience the world three-dimensionally, it is the natural way we view things. To switch on the 3D view, open any project and just click on the 3D button at the bottom-right side. And now you are ready to start exploring restoration and conservation projects…. The natural way.

Image link

Teams & user role management

Build up your communications team for map-based and transparent project communication. Simply add teams and user roles to your project and organization profiles

Image link

Contact details management

Visitors of the project profile can contact you directly. Create an overview of contacts and contact persons in your organization.

Image link

Access control

Decide who can see what content. Projects can stay in draft status as you build your content, be published but not listed on the explorer.land search engine, or be published and listed.

Image link

User dashboard

An intuitive user dashboard provides clean and structured access to content, modules, settings, reports, and user role management.

Image link

Visitor statistics

Track visitor statistics. Learn who is visiting your profiles and from where they are coming.

Image link

Microsite management

Divide polygons into many smaller units and unlist them from the general project view. These unlisted micro polygons can be used e. g. for integration into web shops, loyalty programs, or a spatial representation of ecosystem services.

Image link

Aggregation of multiple projects and organizations

Connect multiple projects and organizations and make them visible in one view. Show and link all projects, actors, and organizations related to a larger program or multi-stakeholder initiative.

Landscape view

A landscape view is composed of several project views which together represent a landscape. On top of project views, additional geographic context and data (relevant for describing the landscape and the included projects) can be added and made visible with this feature.

Image link