We can only protect what we can recognize and measure. Nature restoration projects are no longer a hopeful idea—they are a necessity to stabilize our environment. From rewilding landscapes to restoring degraded ecosystems and building climate resilience, the demand for credible, transparent, and measurable impact is rapidly growing.
But how can project developers demonstrate progress on the ground? How can funders and corporate sponsors verify that their investments lead to real-world outcomes?
This is where explorer.land steps in—with a powerful suite of thematic geospatial data layers designed specifically for the nature-based sector. These layers provide the scientific backbone for
- transparent project planning
- robust monitoring
- compelling storytelling.
Whether you’re designing a reforestation project, validating carbon claims, or ensuring EUDR compliance, these data layers enable high-resolution, globally consistent insights critical for decision-making.
For project developers, the layers support strategic site selection, threat analysis, and ongoing verification.
For funders and investors, they offer a lens into project performance, environmental co-benefits, and analysis of project portfolios.
For corporate sponsors, dynamic thematic data layers enable measurable, transparent impact aligned with sustainability goals and evidence-based storytelling.
Let’s explore the thematic data library on explorer.land and how it meets the needs of today’s landscape stewards and tomorrow’s sustainability leaders.
Supporting Nature-Based Solutions with Thematic Data Layers
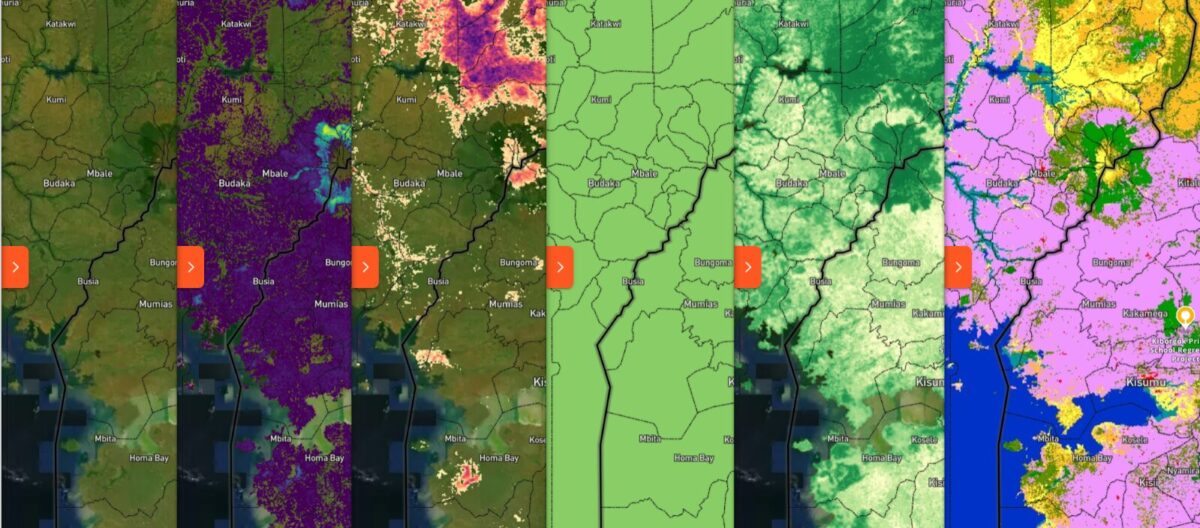
explorer.land provides access to a growing library of dozens of global thematic data layers, which form a strong fundament for understanding and managing nature-based projects.
Key Thematic Data Layer Categories
Thematic data layers track deforestation and forest fragmentation for landscape connectivity, assess tree cover and biomass density for carbon storage and forest health, evaluate soil carbon and tree biomass for soil health and carbon sequestration, and identify priority ecoregions for high biodiversity. These layers help stakeholders visualize and analyze environmental conditions, informing site selection, land management, and impact assessment.
Forest Change & Dynamics
The “Forest Change & Dynamics” category specifically focuses on data related to changes in forest ecosystems, providing insights into deforestation, forest fragmentation, and other dynamic aspects crucial for understanding and managing forests.
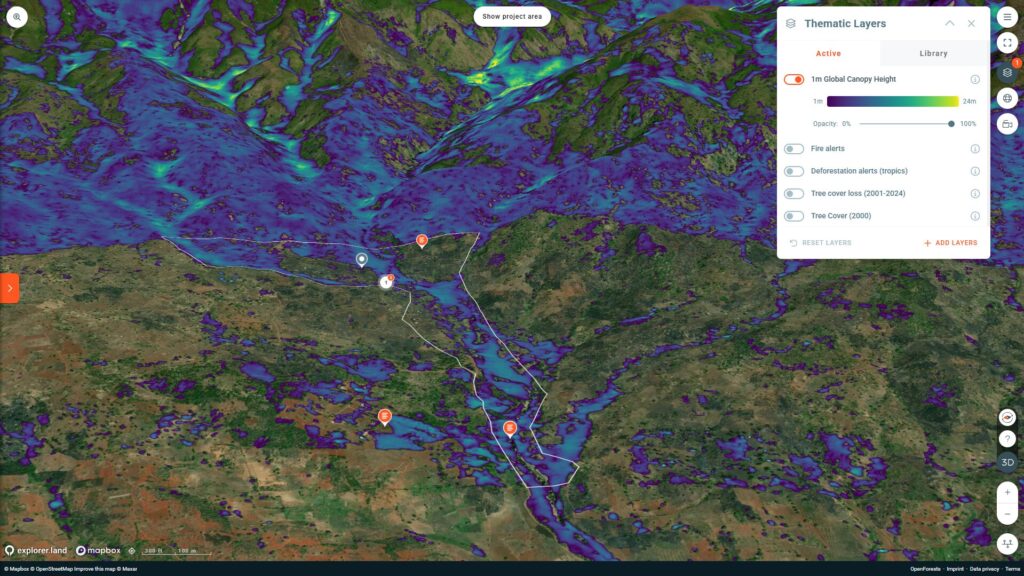
Global Canopy Height Maps (2009-2020)
| Key Property | Resolution | UpdateaFrequency | Description |
| Data Details | 1 meter | Last updated 2024 (period analyzed 2009-2020) | These maps, developed by Meta and the World Resources Institute, offer precise predictions of tree canopy presence and height. They are crucial for assessing carbon stocks and the effectiveness of mitigation strategies, providing comprehensive insights into forest structure and dynamics. |
How it’s used: Project developers use this data for baseline assessments in restoration projects (e.g., to analyze existing forest structures for tree planting plans). Investors and funders can estimate biomass and carbon sequestration potential to optimize investment decisions. Corporates use it for transparent impact monitoring of forest restoration efforts, verifying tree growth and carbon uptake for carbon credits or EUDR compliance.
Source & Access to dataset: Google Earth Engine – Community Catalog; accessible via Google Earth Engine, Meta AI blog post, Earth Blox review (provides context)
Credits:
- Authors: Tolan, J., Yang, H.I., Nosarzewski, B., Couairon, G., Vo, H.V., Brandt, J., Spore, J., Majumdar, S., Haziza, D., Vamaraju, J., and Moutakanni, T., 2024.
- Publication: Very high-resolution canopy height maps from RGB imagery using self-supervised vision transformer and convolutional decoder trained on aerial lidar. Remote Sensing of Environment, 300, p.113888.
- Research Paper: Available here.
Comments:
- Related Blog Post: Available here.
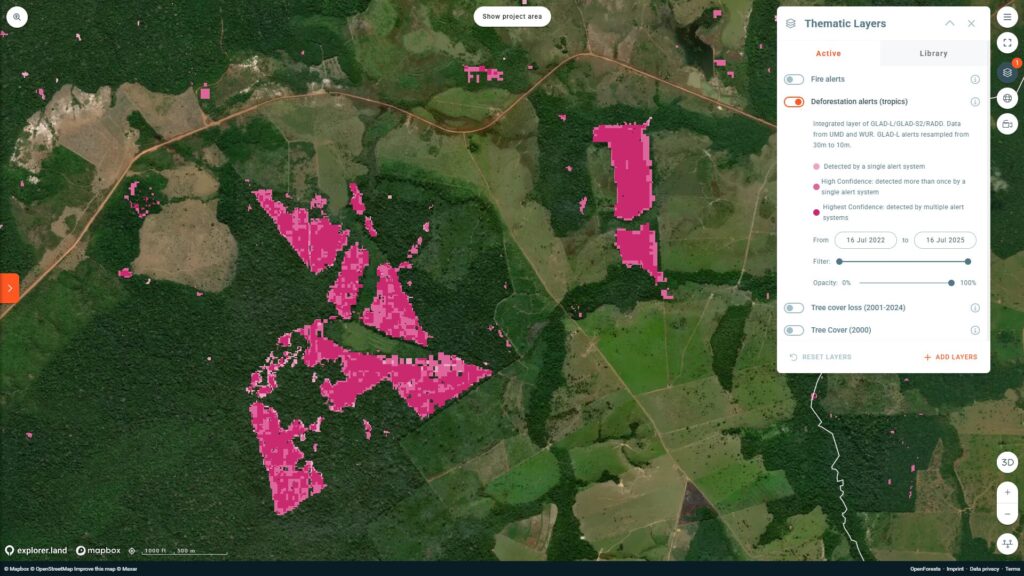
Deforestation Alerts (Tropics, Dec. 2020 – present)
| Key Property | Resolution | Update Frequency | Description |
| Data Details | 10 meters | Daily | This dataset integrates alerts from three systems (GLAD, GLAD-S2, RADD) to monitor forest disturbance in near real-time across tropical regions. It allows for faster detection of potential deforestation events, though it’s important to note it detects disturbances and doesn’t always distinguish between human-caused and natural factors. |
How it’s used: Project developers utilize these alerts for real-time monitoring of project boundaries to detect illegal logging or encroachment, enabling rapid response. Funders can identify high-risk areas for deforestation that might impact their investments’ longevity. Corporates use it to flag recent deforestation in sourcing regions for EUDR compliance or to demonstrate proactive monitoring for CSR.
Source & Access to dataset: Integrates alerts from GLAD, GLAD-S2, and RADD systems; accessible via Resource Watch (overview), Global Forest Watch (integrated alerts)
Credits:
Comments:
- Data Availability: The data is available to download from Global Forest Watch here.
Deforestation Fronts (2004-2017, 2020)
| Key Property | Resolution | Update Frequency | Description |
| Data Details | 250 meters | Last updated 2020 | Focusing on tropical regions, this dataset analyzes emerging hotspots and deforestation fronts using Terra-i data. It employs neural network machine learning to differentiate anthropogenic vegetation loss from natural events, offering crucial insights into the spatial and temporal patterns of deforestation. |
How it’s used: Project developers use this to analyze historical land use changes around potential sites, helping predict future threats and design resilient projects. Funders can understand historical deforestation patterns to inform risk assessments for long-term investments. Corporates can assess the historical impact of their supply chains on forest ecosystems for due diligence and EUDR compliance.
Source & Access to dataset: GLOBIL (Global Biodiversity Information and Landscape); accessible via WWF Deforestation Fronts, WWF Deforestation Fronts Report PDF
Credits:
- Methodology: The methodology documentation can be accessed here.
Forest Fragmentation (2017)
| Key Property | Resolution | Update Frequency | Description |
| Data Details | 250 meters | Last updated 2017 | This global dataset analyzes forest fragmentation as a proxy for degradation. It reveals how continuous forests are broken into smaller patches, impacting ecosystem services like carbon storage and biodiversity. The analysis categorizes changes into primary and secondary degradation, highlighting the severity of human impacts. |
How it’s used: Project developers use this to prioritize restoration efforts by identifying fragmented areas that would benefit most from connectivity improvements, enhancing ecological impact. Funders can evaluate the ecological health and resilience of forest assets, identifying areas where fragmentation might reduce long-term investment value. Corporates monitor the ecological integrity of areas where they invest in forest restoration, ensuring efforts lead to more intact ecosystems for CSR and marketing.
Source: GLOBIL (Global Biodiversity Information and Landscape).
Comments:
- Additional Information: This analysis was conducted for the WWF Deforestation Fronts Report 2020. Link to the study.
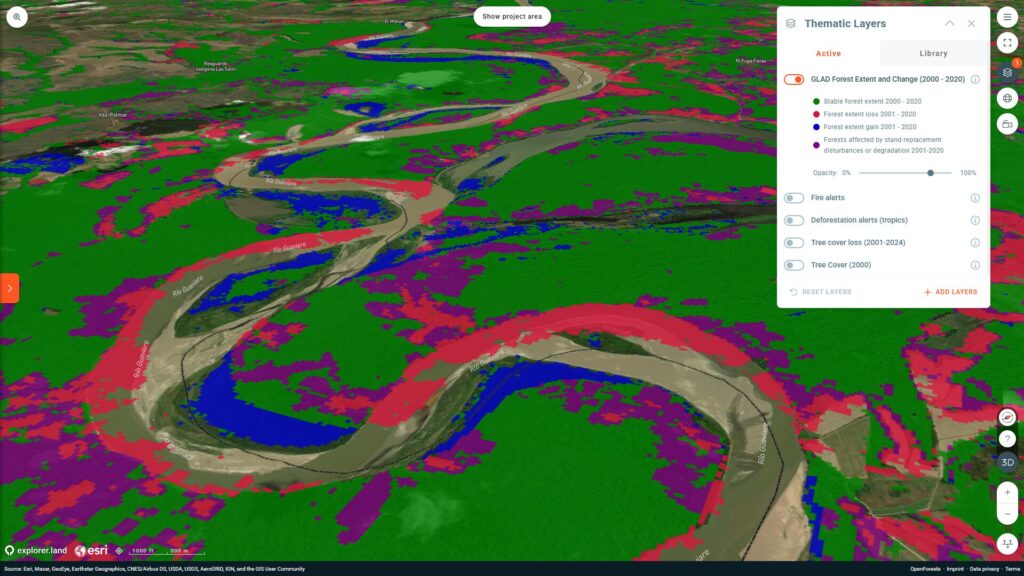
GLAD Forest Extent and Change (2000-2020)
| Key Property | Resolution | Update Frequency | Description |
| Data Details | 30 meters | Last updated 2020 | This global dataset from the University of Maryland provides detailed information on forest cover and its changes over two decades. It maps deforestation, forest growth, and recovery, consistent with FAO forest definitions, using Landsat and GEDI observations. |
How it’s used: Project developers use this to establish accurate baselines for project design and carbon accounting. Funders can track the overall success of large-scale forest conservation or restoration portfolios over time, demonstrating impact to stakeholders. Corporates use it for comprehensive impact monitoring of their contributions to forest restoration, verifying changes in forest extent and demonstrating compliance with sustainability goals.
Source & Access to dataset: GLAD Forest Extent and Change Dataset, with data accessible via Google Earth Engine, UMD GLAD dataset download page, Google Earth Engine (Hansen Global Forest Change v1.12), Global Forest Watch (overview of data methods)
Credits:
- Authors/Publication: Potapov, P., Li, X., Hernandez-Serna, A., Tyukavina, A., Hansen, M.C., Kommareddy, A., Pickens, A., Turubanova, S., Tang, H., Silva, C.E., Armston, J., Dubayah, R., Blair, J.B., Hofton, M. (2020). Mapping and monitoring global forest canopy height through integration of GEDI and Landsat data. Remote Sensing of Environment, 112165. DOI Link.
GLAD Forest Height Change (2000-2020)
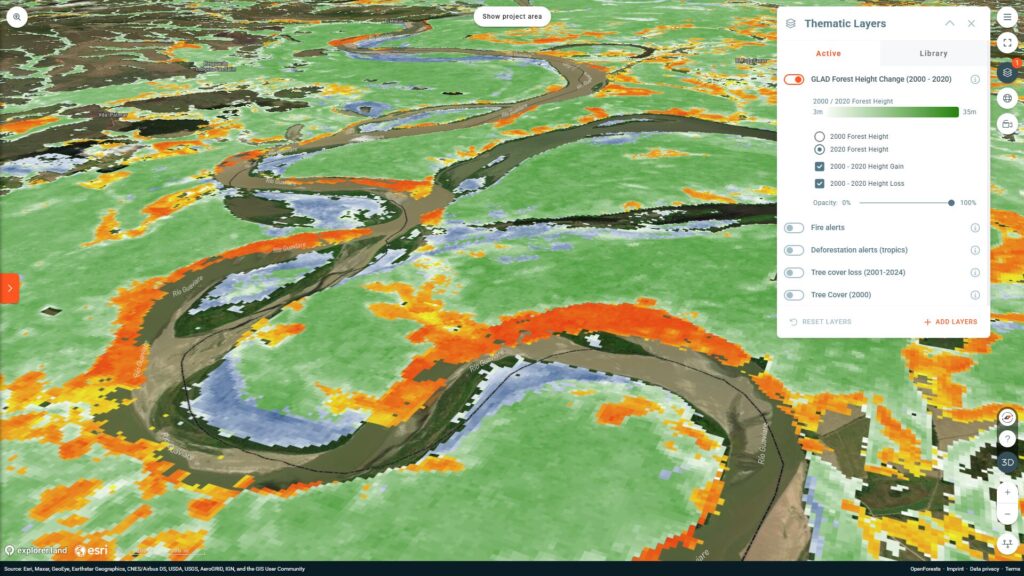
| Key Property | Resolution | Update Frequency | Description |
| Data Details | 30 meters | Last updated 2020 | Complementing the extent data, this global layer visualizes changes in forest canopy height, offering insights into growth, loss, and regeneration. It helps monitor the effectiveness of reforestation efforts and understand forest health trends. |
How it’s used: Project developers monitor the success of tree planting initiatives, verifying actual height gain and assessing forest health. Funders assess the growth trajectory and health of forest assets within nature-based solutions portfolios. Corporates use this for detailed impact reporting on forest restoration projects, showing measurable increases in canopy height for carbon sequestration claims.
Access to the dataset can be found via: Sci-Hub (PDF of publication), Resource Watch (overview)
Credits:
- Authors/Publication: Potapov, P., Li, X., Hernandez-Serna, A., Tyukavina, A., Hansen, M.C., Kommareddy, A., Pickens, A., Turubanova, S., Tang, H., C.E. Silva, J. Armston, R. Dubayah, J. B. Blair, M. Hofton (2020). Mapping and monitoring global forest canopy height through integration of GEDI and Landsat data. Remote Sensing of Environment, 112165. DOI Link.
Tree Cover Gain (2001-2012)
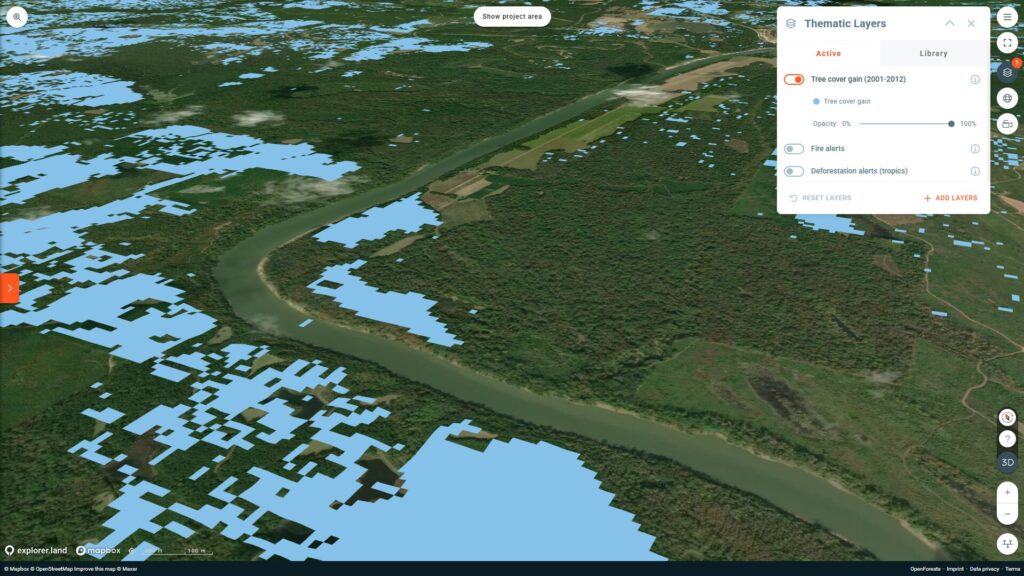
| Key Property | Resolution | Update Frequency | Description |
| Data Details | 30 meters | Last updated 2013 (period analyzed 2001-2012) | This global dataset identifies areas that gained tree cover, transitioning from non-forest in 2000 to ≥50% cover by 2012. It’s vital for understanding forest regeneration and restoration efforts, highlighting the role of forests in climate change mitigation. |
How it’s used: Project developers use this to plan and implement forest restoration projects in areas with high potential for tree cover gain. Funders identify successful reforestation or natural regeneration areas to guide future investments in proven strategies. Corporates demonstrate positive contributions to forest landscape restoration, showing measurable increases in tree cover as part of their sustainability reporting for CSR and marketing.
Source & Access to dataset: Original data accessed through Resource Watch; further details available via Global Forest Watch Open Data Portal, Resource Watch
Credits:
- Authors/Publication: Hansen, M. C., P. V. Potapov, R. Moore, M. Hancher, S. A. Turubanova, A. Tyukavina, D. Thau, S. V. Stehman, S. J. Goetz, T. R. Loveland, A. Kommareddy, A. Egorov, L. Chini, C. O. Justice, and J. R. G. Townshend. (2013). “High-Resolution Global Maps of 21st-Century Forest Cover Change.” Science, 342(15 November): 850–853.
- Publication: Link to publication.
Comments:
- Link to the full data and access: Available here.
Tree Cover Loss (2001-2024)
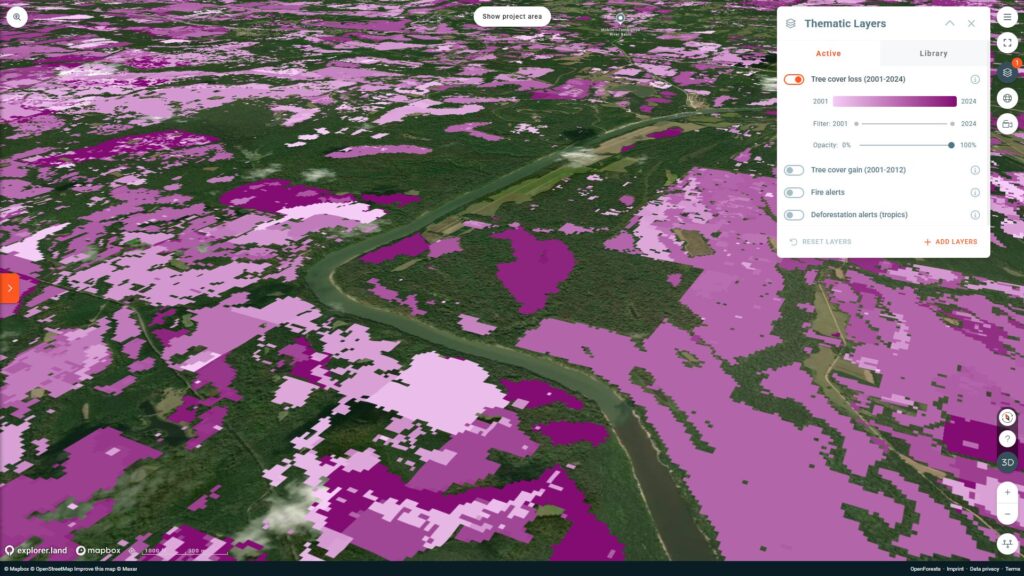
| Key Property | Resolution | Update Frequency | Description |
| Data Details | 30 meters | Annually | Annually updated, this global dataset tracks areas where tree cover has been completely removed due to human activities (like deforestation and timber harvesting) or natural causes (like disease and storms). It provides critical insights into the causes and impacts of forest loss. |
How it’s used: Project developers use this to identify historical and ongoing deforestation pressures around project sites, informing threat mitigation strategies. Funders assess deforestation risk in potential investment areas or monitor ongoing forest loss in their existing portfolios. Corporates use it for EUDR compliance by identifying tree cover loss in their supply chain sourcing areas, or for transparently reporting negative impacts they aim to mitigate for CSR.
Source & Access to dataset: Original data accessed through Google Earth Engine; further details available via Google Earth Engine, Google Earth Engine (current version), Global Forest Watch
Credits:
- Authors/Publication: Hansen, M. C., P. V. Potapov, R. Moore, M. Hancher, S. A. Turubanova, A. Tyukavina, D. Thau, S. V. Stehman, S. J. Goetz, T. R. Loveland, A. Kommareddy, A. Egorov, L. Chini, C. O. Justice, and J. R. G. Townshend. (2013). “High-Resolution Global Maps of 21st-Century Forest Cover Change.” Science, 342(15 November): 850–853.
- Data available online: https://www.science.org/doi/full/10.1126/science.1244693.
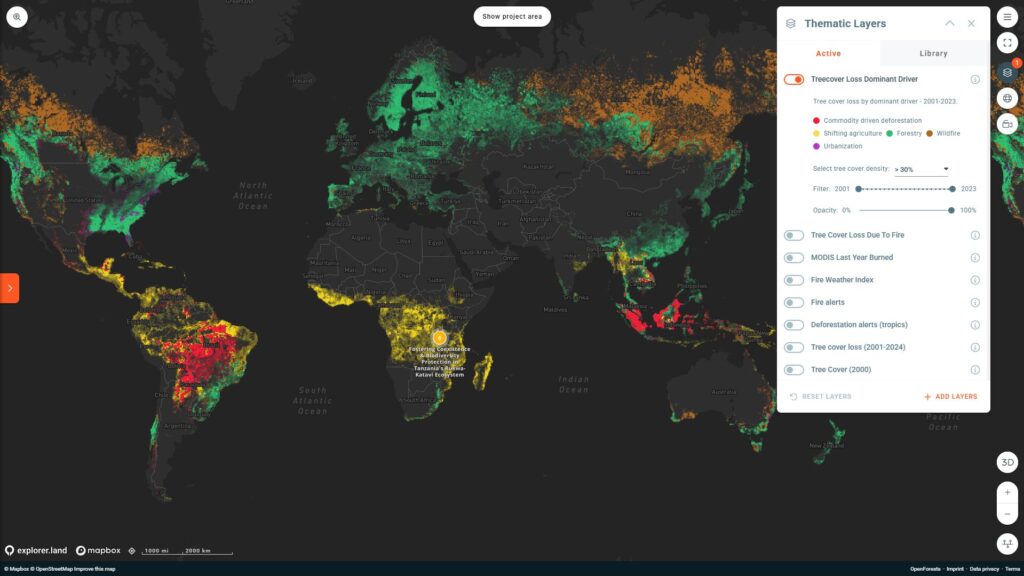
Treecover Loss Dominant Driver (2001-2023)

| Key Property | Resolution | Update Frequency | Description |
| Data Details | 10 km x 10 km | Annually | This global grid identifies the primary drivers of tree cover loss, categorizing them into commodity-driven deforestation, shifting agriculture, forestry, wildfire, and urbanization. This helps pinpoint the most significant factors contributing to forest destruction. |
How it’s used: Project developers tailor intervention strategies based on the dominant threats in their project area, such as focusing on sustainable agriculture if commodity-driven deforestation is prevalent. Funders understand underlying causes of deforestation for more targeted investments. Corporates identify high-risk supply chain geographies based on dominant drivers for EUDR compliance and driving systemic change.
Source & Access to dataset: Global Forest Watch; accessible via Google Earth Engine, Global Forest Watch (on map and dashboards), GFW blog post
Tropical Moist Forest Transition (1990-2023)
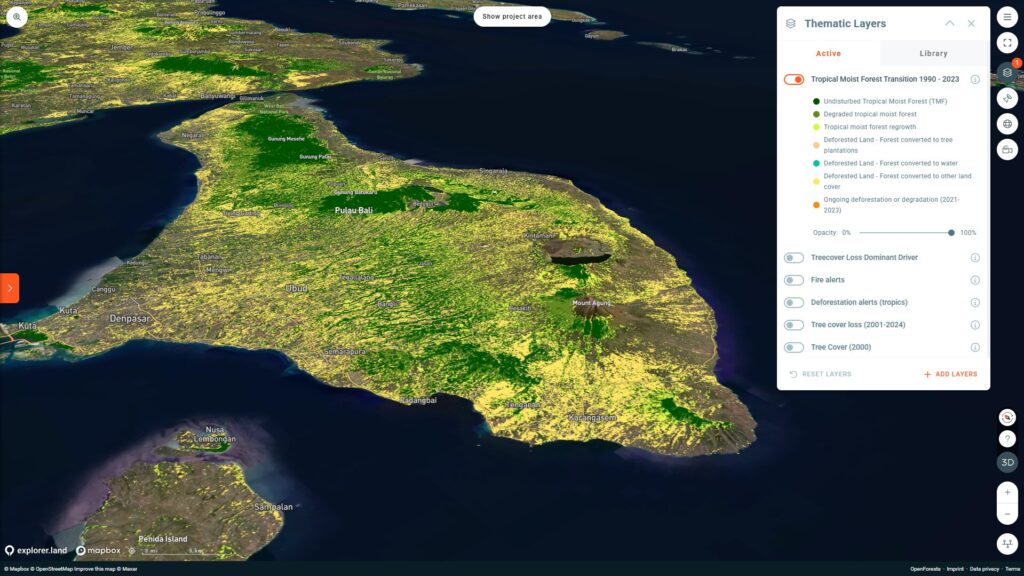
| Key Property | Resolution | Update Frequency | Description |
| Data Details | 30 meters (0.09 hectares per pixel) | Annually | This dataset from the European Commission’s Joint Research Centre (EC JRC) provides detailed maps of tropical moist forests (TMF) over 42 years of Landsat time series data. It includes transition maps (deforestation and degradation) and annual change collection, distinguishing between permanent land cover change and temporary disturbances. |
How it’s used: Project developers use this for historical analysis of TMF changes in proposed project areas to define baselines for restoration or conservation projects. Funders analyze long-term deforestation and degradation trends for evaluating investment risks and opportunities in nature-based solutions. Corporates assess the long-term impact of their supply chains on tropical forests for EUDR compliance.
Source & Access to dataset: European Commission Joint Research Centre (EC JRC) – Tropical Moist Forest Transition; accessible via JRC TMF data portal, CIFOR-ICRAF (publication page)
Credits:
- Authors/Publication: Vancutsem, C., Achard, F., Pekel, J.-F., Vieilledent, G., Carboni, S., Simonetti, D., Gallego, J., Aragão, L.E.O.C., Nasi, R. (2021). Long-term (1990-2019) monitoring of forest cover changes in the humid tropics. Science Advances. DOI Link.
- Methodology: For a comprehensive explanation of the methodology, refer to Science Advances – Methodology.
Primary Forests (2001)

| Key Property | Resolution | Update Frequency | Description |
| Data Details | 30 × 30 meters | Last updated 2018 (for 2001 data) | This dataset maps the extent of primary forests in global pan-tropical regions. Defined as “mature natural humid tropical forest cover that has not been completely cleared and regrown in recent history,” these forests are vital for biodiversity and carbon accounting. |
How it’s used: Project developers use this to delineate and protect primary forest areas within or adjacent to their projects, ensuring no net loss of critical habitats. Funders identify and prioritize investments in the protection of irreplaceable primary forest ecosystems. Corporates demonstrate that their supply chains are not linked to primary forest destruction, a key component of robust no-deforestation commitments and EUDR compliance.
Source: Turubanova, S., Potapov, P.V., Tyukavina, A. and Hansen, M.C., 2018. Ongoing primary forest loss in Brazil, Democratic Republic of the Congo, and Indonesia. Environmental Research Letters, 13(7), p.074028. Accessed through Global Forest Watch.
Tree Cover (2000)
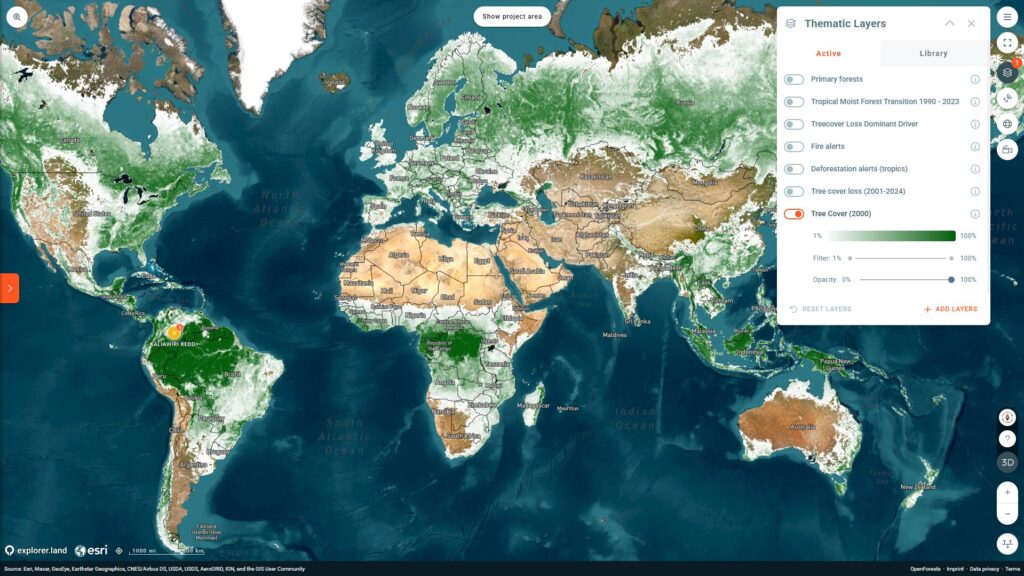
| Key Property | Resolution | Update Frequency | Description |
| Data Details | 30 meters | Last updated 2013 (for 2000 data) | This global dataset measures areas with ≥10% canopy cover in the year 2000, defining tree cover as vegetation greater than 5 meters in height. It serves as a baseline for understanding subsequent forest changes and their impact on ecosystem services. |
How it’s used: Project developers use this to accurately define the “forest” baseline for carbon projects or restoration initiatives. Funders establish baselines for forest cover in potential investment regions, allowing for the measurement of future changes and impacts. Corporates understand historical forest cover in their sourcing areas, providing a foundational dataset for tracking deforestation trends and demonstrating EUDR compliance.
Source & Access to dataset: Data available through Google Earth Engine; further details available via Global Forest Watch Open Data Portal
Credits:
- Authors/Publication: Hansen, M. C., P. V. Potapov, R. Moore, M. Hancher, S. A. Turubanova, A. Tyukavina, D. Thau, S. V. Stehman, S. J. Goetz, T. R. Loveland, A. Kommareddy, A. Egorov, L. Chini, C. O. Justice, and J. R. G. Townshend. (2013). “High-Resolution Global Maps of 21st-Century Forest Cover Change.” Science, 342(15 November): 850–853.
- DOI Link: https://www.science.org/doi/full/10.1126/science.1244693.
Fires & Fire-Related Dynamics
Fires, whether natural or human-induced, are a major force shaping ecosystems. These layers provide crucial fire intelligence:
Fire Alerts (Last 90 days)

| Key Property | Resolution | Update Frequency | Description |
| Data Details | 375 meters | Twice daily | This global dataset from NASA provides near real-time fire locations. It uses the VIIRS sensor and a sophisticated algorithm to detect active fires, offering confidence levels (low, nominal, high) for each detection. |
How it’s used: Project developers use this for real-time monitoring of fire outbreaks within or near project areas, enabling immediate intervention and damage assessment. Funders can conduct rapid assessments of fire threats to nature-based solution assets for risk management. Corporates monitor fire incidents in their supply chain regions to assess risks to sourcing and demonstrate proactive environmental management for CSR.
Source & Access to dataset: NASA, accessed through Resource Watch; accessible via FIRMS Fire Map, NASA Earthdata (VIIRS 375m product)
Credits:
- Data and Imagery: Provided by LANCE FIRMS, operated by the NASA/GSFC/Earth Science Data and Information System (ESDIS) with funding provided by NASA/HQ.
- NASA Data & Information Policy: here.
- Methodology: Full Methodology Documentation: Available in the source methodology linked here.
Fire Weather Index (2015-present)
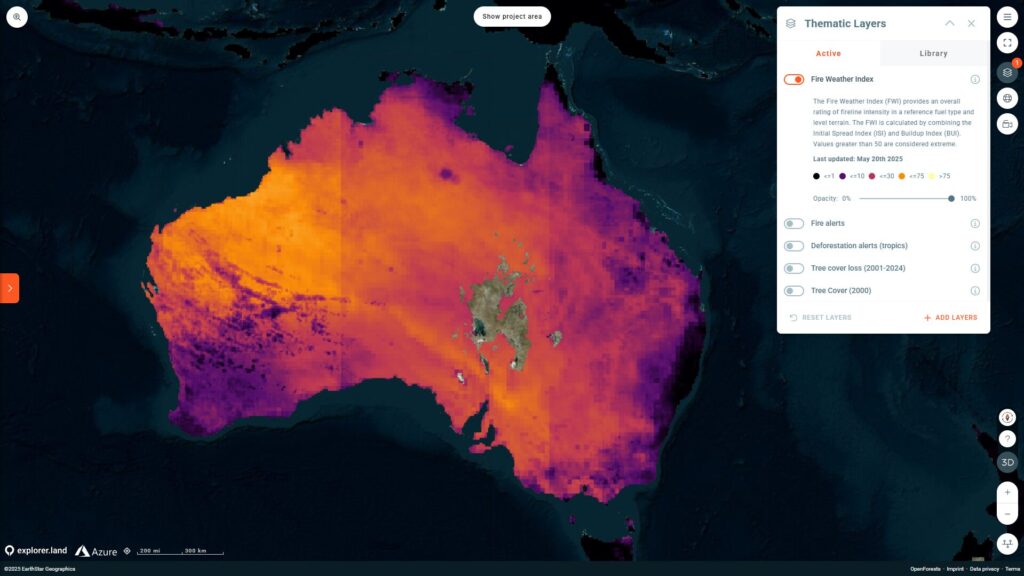
| Key Property | Resolution | Update Frequency | Description |
| Data Details | 0.1° (approx. 11 km) | Daily | This global dataset from NASA/GFWED provides an overall rating of fireline intensity. It combines factors like temperature, humidity, wind speed, and precipitation, with values over 50 indicating extreme fire danger. |
How it’s used: Project developers implement proactive fire prevention and early warning systems based on predicted fire danger to protect project sites. Funders evaluate fire risk exposure for nature-based solutions investments, especially in fire-prone ecosystems, informing portfolio diversification. Corporates assess climate-related risks to their operations or supply chains, particularly concerning forest fires impacting raw material availability or carbon credit integrity.
Source & Access to dataset: NASA/GFWED; accessible via NASA Center for Climate Simulation Dataportal, GFWED Website
Credits:
- Organization: NASA/Goddod Institute for Space Studies (GISS), Global Fire Weather Database (GFWED) Archive.
MODIS Fire Frequency (Nov. 2000 – present)
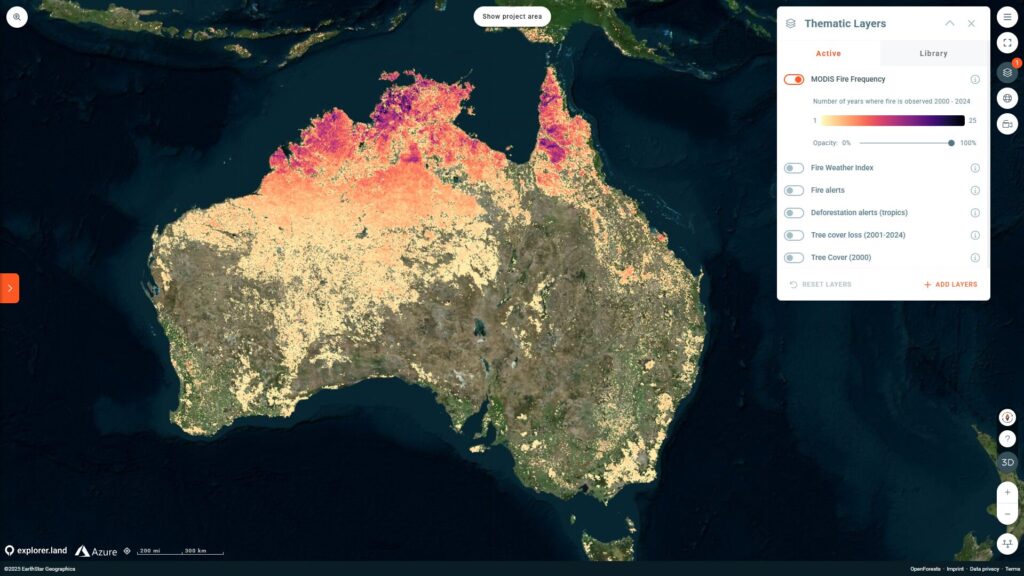
| Key Property | Resolution | Update Frequency | Description |
| Data Details | 500 meters | Monthly | This global dataset shows the number of years a fire has been recorded for each pixel. It uses MODIS imagery and active fire observations to identify burn dates and provides insights into fire recurrence. |
How it’s used: Project developers use this to identify areas with high historical fire frequency, informing fire management strategies and species selection for restoration. Funders understand historical fire regimes in potential investment areas, assessing the long-term sustainability of nature-based solutions. Corporates evaluate long-term fire risk in their operational or sourcing landscapes, informing sustainable land management practices and risk mitigation for carbon credits.
Source & Access to dataset: LP DAAC MODIS Product; accessible via Earth Engine MODIS Dataset
Credits:
- Citation Information: Please visit the LP DAAC Citing Our Data page for information on citing LP DAAC datasets.
MODIS Last Year Burned (Nov. 2000 – present)

| Key Property | Resolution | Update Frequency | Description |
| Data Details | 500 meters | Monthly | Similar to fire frequency, this global dataset identifies the most recent year a fire was detected for each pixel, essential for tracking long-term fire events and understanding fire regimes. |
How it’s used: Project developers use this to identify recently burned areas suitable for post-fire restoration or to understand the impact of recent fires on project progress. Funders quickly assess the recency of fire events in a region, impacting the immediate viability or recovery potential of nature-based solutions projects. Corporates use this for post-fire impact assessment in their supply chain areas, informing recovery efforts or adjustments to sourcing strategies.
Source & Access to dataset: LP DAAC MODIS Product; accessible via Earth Engine MODIS Dataset
Credits:
- Citation Information: Please visit LP DAAC Citing Our Data page for information on citing LP DAAC datasets.
Tree Cover Loss Due To Fire (2001-2022)
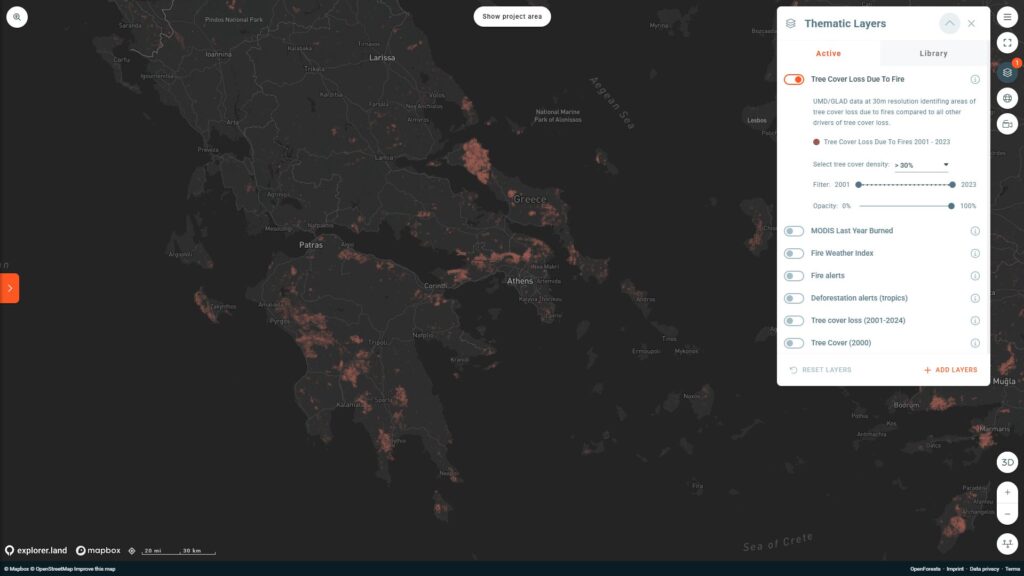
| Key Property | Resolution | Update Frequency | Description |
| Data Details | 30 meters | Annually | Identifies areas of tree cover loss specifically due to fires, distinguishing fire-driven loss from all other causes of tree cover loss. |
How it’s used: Project developers analyze the historical contribution of fire to forest loss in a project area, informing fire management and restoration approaches. Funders assess the specific risk of fire-induced tree cover loss in investments for targeted risk mitigation strategies. Corporates understand how fire impacts their raw material sourcing regions or the integrity of their carbon offset projects for transparent impact monitoring.
Source & Access to dataset: GLAD Fire Dataset; accessible via Google Earth Engine (viewer), Global Forest Watch (latest analysis)
Credits:
- Authors/Publication: Tyukavina, A., Potapov, P., Hansen, M.C., Pickens, A., Stehman, S., Turubanova, S., Parker, D., Zalles, A., Lima, A., Kommareddy, I., Song, X-P, Wang, L, and Harris, N. (2022). Global trends of forest loss due to fire, 2001-2019. Frontiers in Remote Sensing.
- DOI Link: https://doi.org/10.3389/frsen.2022.825190.
Treecover Loss Dominant Driver (2001-2023)
| Key Property | Resolution | Update Frequency | Description |
| Data Details | 10 km x 10 km | Annually | This global grid identifies the primary drivers of tree cover loss, categorizing them into commodity-driven deforestation, shifting agriculture, forestry, wildfire, and urbanization. This helps pinpoint the most significant factors contributing to forest destruction. |
How it’s used: Project developers tailor intervention strategies based on the dominant threats in their project area, such as focusing on sustainable agriculture if commodity-driven deforestation is prevalent. Funders understand underlying causes of deforestation for more targeted investments. Corporates identify high-risk supply chain geographies based on dominant drivers for EUDR compliance and driving systemic change.
Source & Access to dataset: Global Forest Watch; accessible via Google Earth Engine, Global Forest Watch (on map and dashboards), GFW blog post
Land Cover & Land Use
Understanding how land is used and covered is fundamental to environmental management:
Global Mangrove Watch 2020

| Key Property | Resolution | Update Frequency | Description |
| Data Details | 10 meters | Last updated 2020 | This global map enhances the resolution of mangrove extent, remapping areas using Copernicus Sentinel-2 imagery and advanced machine learning. It’s crucial for monitoring these vital coastal ecosystems. |
How it’s used: Project developers use this to accurately delineate mangrove restoration or conservation project areas, ensuring precise mapping and monitoring. Funders identify and evaluate potential blue carbon projects in mangrove ecosystems, assessing their extent and conservation status. Corporates transparently monitor investments in coastal ecosystem restoration, verifying mangrove health and extent as part of their sustainability commitments.
Source: Global Mangrove Alliance.
Credits:
- Publications:
- Zanaga, D., Van De Kerchove, R., De Keersmaecker, W., Souverijns, N., Brockmann, C., Quast, R., Wevers, J., Grosu, A., Paccini, A., Vergnaud, S., Cartus, O., Santoro, M., Fritz, S., Georgieva, I., Lesiv, M., Herold, M., Li, Linlin, Tsendbazar, N.E., Ramoino, F., Arino, O., 2021. ESA WorldCover 10 m 2020 v100.
- Murray, N.J.; Bunting, P.; Canto, R.F.; Hilarides, L.; Kennedy, E.V.; Lucas, R.M.; Lyons, M.B.; Navarro, A.; Roelfsema, C.M.; Rosenqvist, A.; et al. coastTrain: A Global Reference Library for Coastal Ecosystems. Remote Sensing, 2022, 14, 5766.
Copernicus Global Land Cover (2015-2019)
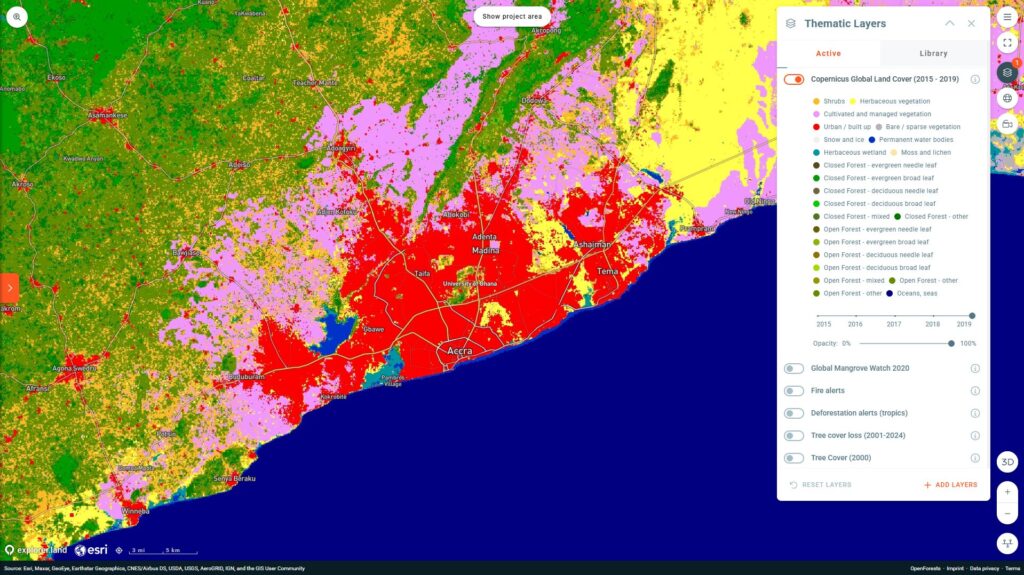
| Key Property | Resolution | Update Frequency | Description |
| Data Details | 100 meters | Annually | This annual, global map provides dynamic land cover information, including discrete classes and continuous field layers. It’s derived from PROBA-V data and is tailored for various applications like forest and crop monitoring. |
How it’s used: Project developers use this for regional land cover context and to identify suitable areas for different types of interventions (e.g., forest restoration, agroforestry). Funders gain a broad understanding of land cover types in regions of interest to inform initial screening for nature-based solutions. Corporates assess land use change in their broader operational landscapes, supporting sustainable sourcing strategies and reporting on land stewardship.
Source & Access to dataset: Copernicus Global Land Service; accessible via Google Earth Engine, Copernicus Global Land Service (download by area/full dataset)
Credits:
- Authors/Publication: Buchhorn, M., Lesiv, M., Tsendbazar, N.-E., Herold, M., Bertels, L., Smets, B. (2020). Copernicus Global Land Cover Layers-Collection 2. Remote Sensing, 12(6), 1044.
- DOI Link: https://doi.org/10.3390/rs12061044.
- Additional references for individual years: Buchhorn, M., Smets, B., Bertels, L., Roo, B.D., Lesiv, M., Tsendbazar, N.-E., Herold, M., & Fritz, S. (2020). Copernicus Global Land Service: Land Cover 100m: Collection 3, Epoch 2015-2019. Zenodo.
ESA CCI Annual Land Cover (1992-2020)
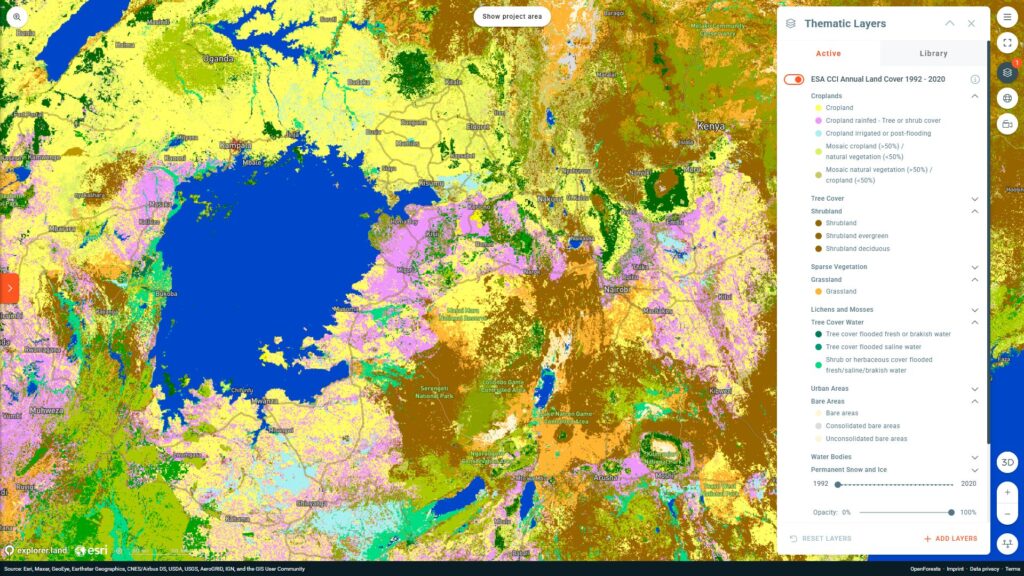
| Key Property | Resolution | Update Frequency | Description |
| Data Details | 300 meters | Not updated (covers 1992-2020) | Offering consistent global annual land cover maps, this dataset is based on the UN Land Cover Classification System (LCCS). It includes 22 global land cover categories, supporting Earth System Models and tracking long-term environmental shifts. |
How it’s used: Project developers use this to analyze the historical land cover evolution of a potential project site, providing context for current conditions and future planning. Funders conduct long-term historical analyses of land cover change, understanding past trends and risks in large geographical areas. Corporates use this to understand long-term land use dynamics impacting their supply chains for long-term sustainability planning.
Source & Access to dataset: ESA Land Cover ESA CCI Land Cover Product; accessible via Microsoft Planetary Computer, ESA CCI Land cover website (download viewer)
Credits:
- Publication Details: For publication details on the ESA Land Cover product, see the ESA Land Cover page.
ESA World Cover (2000-2021)

| Key Property | Resolution | Update Frequency | Description |
| Data Details | 10 meters | Last updated 2022 (for 2021 data) | These global land cover maps are based on Sentinel-1 and Sentinel-2 data. They classify land into 11 generic classes (e.g., Tree cover, Shrubland, Cropland), providing high-resolution insights into recent land cover. |
How it’s used: Project developers use this for highly detailed mapping of current land cover within and around their project area, essential for precise planning and baseline setting. Funders get recent, high-resolution snapshots of land cover for due diligence on specific project sites. Corporates use this for granular land cover assessment in supply chain areas, supporting EUDR compliance.
Source & Access to dataset: © ESA WorldCover project / Contains modified Copernicus Sentinel data (2020 and 2021) processed by the ESA WorldCover consortium; accessible via ESA WorldCover website (data access page), Google Earth Engine (v100 for 2020), Google Earth Engine (v200 for 2021), AWS Open Data Registry (S3 buckets), Zenodo (single tar.gz files/zipped macrotiles) 2020, Zenodo (single tar.gz files/zipped macrotiles) 2021
Credits:
- Authors/Publications:
- Zanaga, D., Van De Kerchove, R., De Keersmaecker, W., Souverijns, N., Brockmann, C., Quast, R., Wevers, J., Grosu, A., Paccini, A., Vergnaud, S., Cartus, O., Santoro, M., Fritz, S., Georgieva, I., Lesiv, M., Herold, M., Li, Linlin, Tsendbazar, N.E., Ramoino, F., Arino, O., (2021). ESA WorldCover 10 m 2020 v100.
- Zanaga, D., Van De Kerchove, R., Daems, D., De Keersmaecker, W., Brockmann, C., Kirches, G., Wevers, J., Cartus, O., Santoro, M., Fritz, S., Lesiv, M., Herold, M., Tsendbazar, N.E., Xu, P., Ramoino, F., Arino, O., (2022). ESA WorldCover 10 m 2021 v200.
- License: Creative Commons Attribution 4.0 International (CC-BY-4.0) License Details.
GLAD Global Land Cover and Land Use Change (2000-2020)
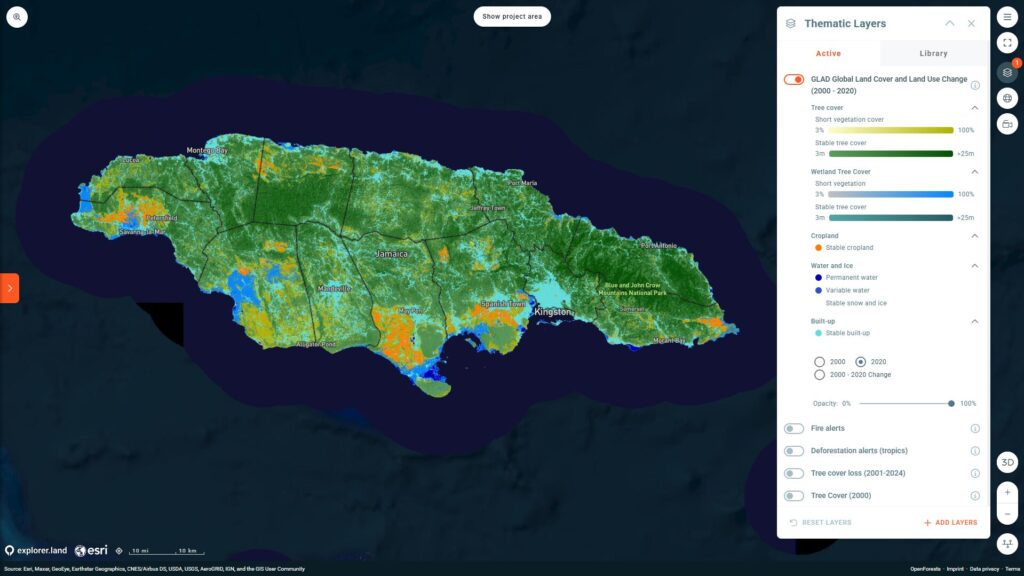
| Key Property | Resolution | Update Frequency | Description |
| Data Details | 30 meters | Last updated 2022 (for 2020 data) | This global dataset quantifies changes in forest extent and height, cropland, built-up lands, surface water, and perennial snow and ice. It uses Landsat archives and machine learning to provide a comprehensive analysis of land dynamics. |
How it’s used: Project developers use this to understand the historical context of land use change at their project location, informing the design of restoration or sustainable land management interventions. Funders analyze historical land use transitions in potential investment landscapes, identifying areas of past degradation or successful restoration. Corporates track changes in land use in their sourcing regions over two decades, providing a historical perspective for sustainability reporting and EUDR compliance.
Source & Access to dataset: GLAD Global Land Cover and Land Use Change Dataset; accessible via UMD GLAD dataset download page, OpenLandMap STAC Browser, MAAP Project STAC Browser, Maya Climate Catalog
Credits:
- Authors/Publication: Potapov P., Hansen M.C., Pickens A., Hernandez-Serna A., Tyukavina A., Turubanova S., Zalles V., Li X., Khan A., Stolle F., Harris N., Song X.-P., Baggett A., Kommareddy I., Kommareddy A. (2022). The global 2000-2020 land cover and land use change dataset derived from the Landsat archive: First results. Frontiers in Remote Sensing.
Global Land Cover Change (1985-2022)

| Key Property | Resolution | Update Frequency | Description |
| Data Details | 30 meters | Annually (every 5 years before 2000) | This global dataset offers pioneering insights into global land cover dynamics. It tracks 35 land-cover subcategories and reveals significant trends like forest loss and cropland expansion. |
How it’s used: Project developers use this to understand the very long-term history of land use and disturbance at a site, crucial for ecological restoration planning. Funders can conduct comprehensive long-term analyses of land use change trends, informing strategic investments in regions undergoing specific transformations. Corporates analyze land cover changes relevant to their supply chains over a multi-decade period, supporting long-term sustainability strategies and robust EUDR due diligence.
Source & Access to dataset: Google Earth Engine – GLC_FCS30D Dataset; accessible via Zenodo, Case Earth, Google Earth Engine Community Catalog (tutorial)
Credits:
- Authors/Publication: Liangyun Liu, Xiao Zhang, & Tingting Zhao. (2023). GLC_FCS30D: The first global 30-m land-cover dynamic monitoring product with fine classification system from 1985 to 2022. Zenodo.
- DOI Link: https://doi.org/10.5281/zenodo.8239305.
Comments:
Global Pasture Watch – Grasslands (2000-2022)
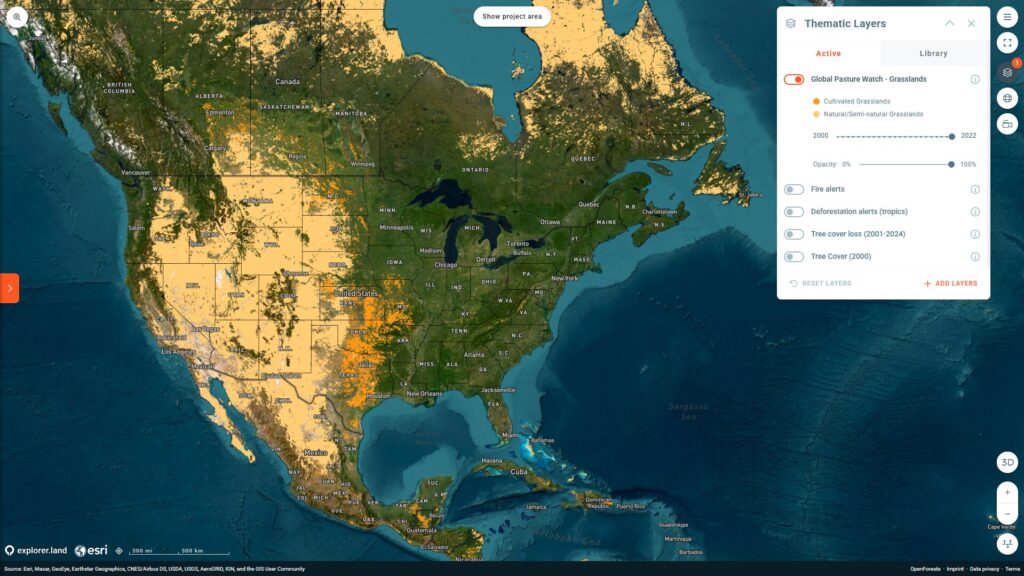
| Key Property | Resolution | Update Frequency | Description |
| Data Details | 30 meters | Unknown | This global dataset maps cultivated, natural, and semi-natural grasslands, distinguishing between managed and undisturbed areas. It uses GLAD Landsat data and machine learning to provide spatiotemporal distribution of these crucial ecosystems. |
How it’s used: Project developers use this to accurately map and monitor grassland ecosystems within their project area for grazing management or grassland restoration initiatives. Funders identify and evaluate investments in sustainable grazing or grassland restoration projects. Corporates ensure their supply chains (e.g., for meat or dairy) are not contributing to grassland degradation, supporting sustainable sourcing and environmental reporting.
Source & Access to dataset: Land and Carbon Lab; accessible via Google Earth Engine (publisher page), Google Earth Engine (dominant class map), Zenodo
Credits:
- Methodology: For more information on the methodology, refer to the publication: Global Pasture Watch Methodology.
- Authors/Publication: Parente, L., Sloat, L., Mesquita, V., Consoli, D., Stanimirova, R., Hengl, T., Bonannella, C., Teles, N., Wheeler, I., Hunter, M., Ehrmann, S., Ferreira, L., Mattos, A. P., Oliveira, B., Meyer, C., Şahin, M., Witjes, M., Fritz, S., Malek, Ž., & Stolle, F. (2024). Annual 30-m maps of global grassland class and extent (2000–2022) based on spatiotemporal Machine Learning.
- Zenodo Record: https://doi.org/10.5281/zenodo.13890401.
GLAD Cropland Extent (2000-2019)

| Key Property | Resolution | Update Frequency | Description |
| Data Details | 30 meters | Last updated 2021 (for 2000-2019 data) | This global dataset maps the extent of land used for annual and perennial herbaceous crops, excluding tree crops and shifting cultivation. It reveals trends in agricultural expansion and global food production. |
How it’s used: Project developers use this to accurately map existing agricultural areas within or surrounding a project site, informing land management and agroforestry planning. Funders analyze agricultural expansion trends and potential land use conflicts in regions targeted for nature-based solutions. Corporates understand the agricultural footprint of their supply chains and identify opportunities for promoting sustainable agriculture or agroforestry practices.
Source & Access to dataset: GLAD Cropland Extent Dataset; accessible via UMD GLAD dataset download page, Google Earth Engine (viewer), Resource Watch
Credits:
- Authors/Publication: Potapov, P., Turubanova, S., Hansen, M.C., Tyukavina, A., Zalles, V., Khan, A., Song, X.P., Pickens, A., Shen, Q., Cortez, J. (2021). Global maps of cropland extent and change show accelerated cropland expansion in the twenty-first century.
Carbon & Biodiversity
These layers directly assess carbon storage and biodiversity health:
Global Forest Above Ground Biomass (2010-2020)
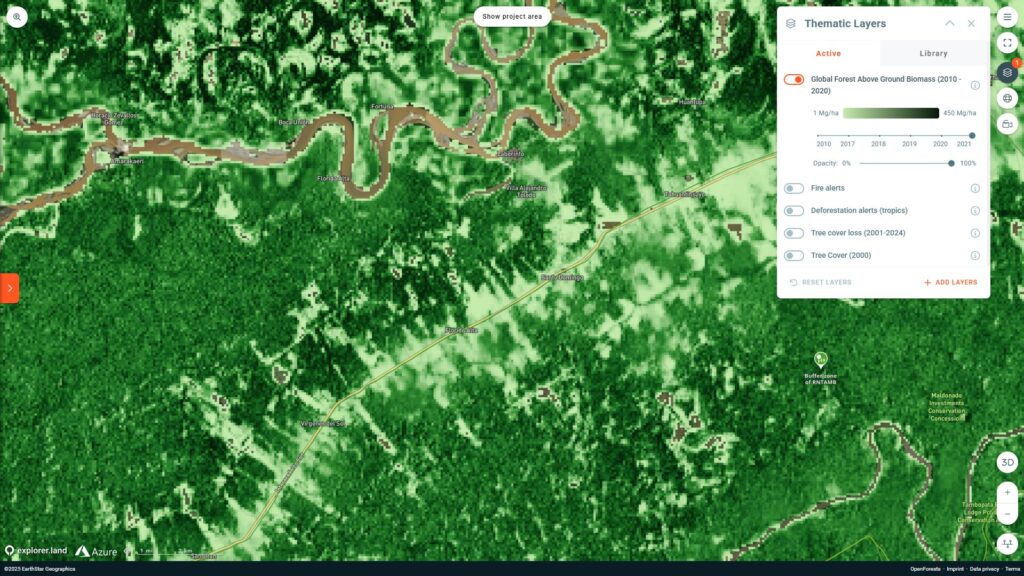
| Key Property | Resolution | Update Frequency | Description |
| Data Details | 100 meters | Last updated 2023 (for 2010-2020 data) | This global dataset provides estimates of forest above-ground biomass (AGB) and its uncertainty. Derived from multiple satellite missions, it’s crucial for climate change research, carbon accounting, and understanding forest health. |
How it’s used: Project developers use this for accurate carbon stock assessments in project areas, enabling robust carbon accounting and verification for carbon market participation. Funders quantify the carbon sequestration potential of forest conservation and restoration projects, directly informing carbon credit investments. Corporates transparently monitor their carbon credit purchases or forest restoration contributions, verifying actual biomass accumulation and associated carbon benefits.
Source & Access to dataset: CCI Biomass Data Catalogue; accessible via NASA Earthdata (CMR), ESA Climate Change Initiative (Biomass page)
Credits:
- Authors/Publication: Santoro, M., Cartus, O. (2023). ESA Biomass Climate Change Initiative (Biomass_cci): Global datasets of forest above-ground biomass for the years 2010, 2017, 2018, 2019, and 2020, v4. NERC EDS Centre for Environmental Data Analysis, 21 April 2023.
- DOI Link: https://dx.doi.org/10.5285/af60720c1e404a9e9d2c145d2b2ead4e.
Soil Carbon Density
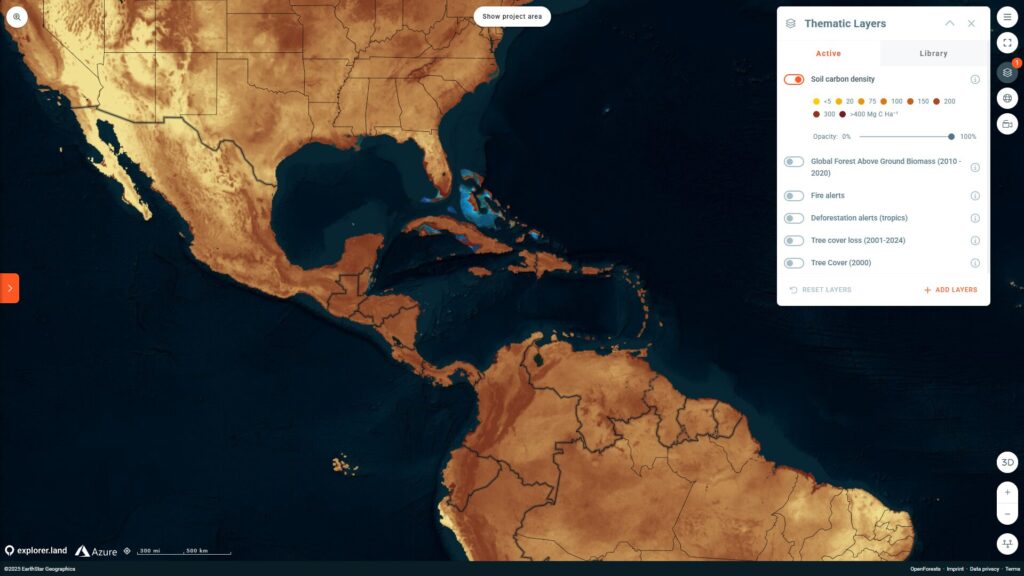
| Key Property | Resolution | Update Frequency | Description |
| Data Details | 30 meters | Varies by data source (2018-2020) | This dataset identifies organic carbon density in the topsoil (0-30 cm depth) globally, integrating general SOC data with specific data for mangrove forests. It’s vital for understanding carbon sequestration, agricultural productivity, and soil health. |
How it’s used: Project developers assess baseline soil carbon levels in project areas and monitor changes over time, quantifying the impact of sustainable land management practices. Funders evaluate the soil carbon sequestration potential of agricultural or land restoration projects, informing investments in regenerative agriculture or peatland restoration. Corporates transparently monitor initiatives aimed at improving soil health or sequestering carbon in agricultural supply chains, contributing to climate goals.
Source & Access to dataset: Sanderman et al. (2018): “Soil Carbon Density”. ISRIC SoilGrids – 2020. Delivered through Global Forest Watch; accessible via ISRIC SoilGrids FAQ, ISRIC SoilGrids API (for data access), SoilGrids.org (portal to web-services)
Credits:
- Authors/Publication: Sanderman, J., Hengl, T., Fiske, G., et al. (2018). A global map of mangrove forest soil carbon at 30 m spatial resolution. Environmental Research Letters, 13: 055002.
- DOI Link: https://doi.org/10.1088/1748-9326/aabe1c.
- ISRIC SoilGrids.
Cautions:
- For more information on data uncertainty, users should refer to the SoilGrids FAQ.
Biodiversity Intactness Index (2017-2020)
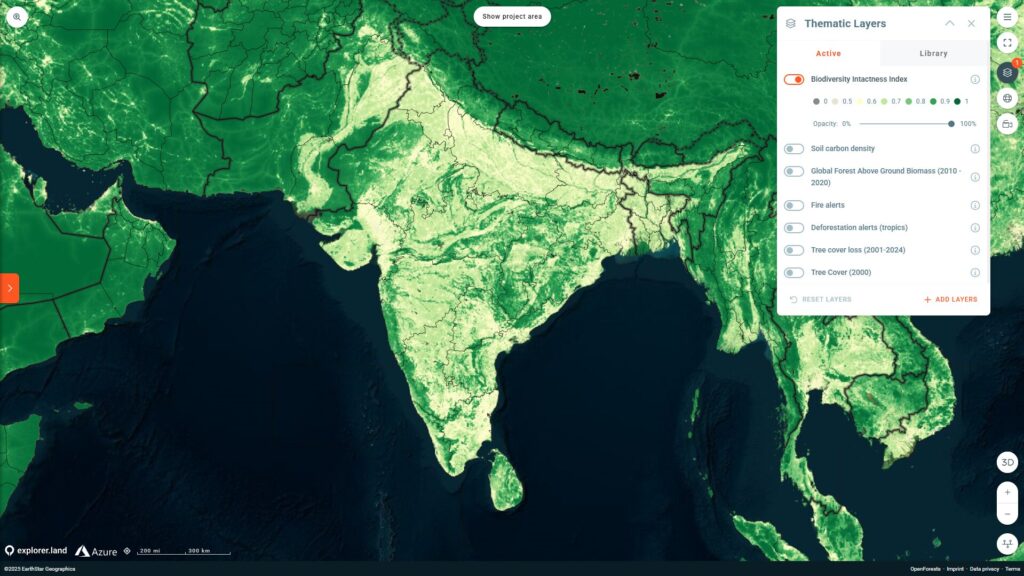
| Key Property | Resolution | Update Frequency | Description |
| Data Details | 100 meters | Last updated 2020 (for 2017-2020 data) | This global dataset measures how local terrestrial biodiversity responds to human pressures. Based on extensive biodiversity observations, it helps assess ecosystem vulnerability and guide global biodiversity preservation efforts. |
How it’s used: Project developers select project locations that offer the greatest potential for biodiversity recovery or protection, maximizing ecological impact. Funders identify and prioritize investments in nature-based solutions that deliver high biodiversity co-benefits. Corporates transparently monitor their contributions to biodiversity conservation, demonstrating how their actions contribute to improving ecosystem health and intactness for CSR and marketing.
Source & Access to dataset: Biodiversity Intactness Index (BII) Dataset; accessible via NHM (limited release), SpatiaFi Data Catalog, Awesome GEE Community Catalog, Earth Blox (access)
WWF Priority Ecoregions
| Key Property | Resolution | Update Frequency | Description |
| Data Details | Varies | Last updated 2018 | This dataset highlights 35 marine and terrestrial ecoregions prioritized by WWF for conservation. These areas represent the world’s most biodiverse places, guiding conservation planning and action in critically important ecological zones. |
How it’s used: Project developers align project locations with established conservation priorities, enhancing the relevance and impact of their work. Funders identify globally significant biodiversity hotspots for strategic investments in conservation and nature-based solutions. Corporates demonstrate alignment with global conservation goals by focusing their environmental contributions on areas recognized as critical for biodiversity.
Source & Access to dataset: GLOBIL; accessible via GLOBIL HUB, WWF Publications (download)
Land Use Rights & Management
These layers provide insights into land governance and human activity impacts:
Indigenous and Community Lands
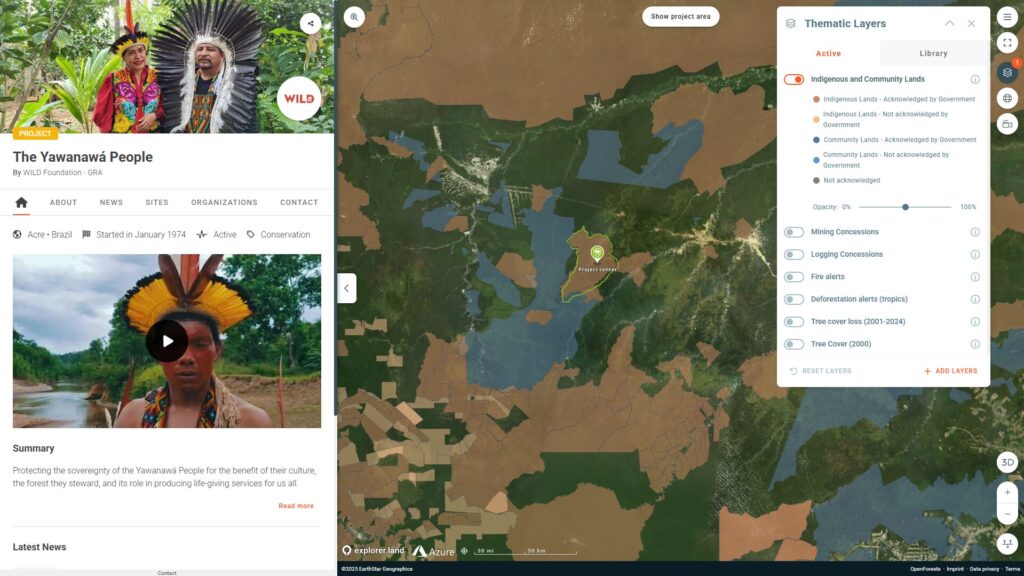
| Key Property | Resolution | Update Frequency | Description |
| Data Details | Varies by source | Quarterly | This dataset depicts indigenous and community lands for select countries, classified by legal recognition status. It is crucial for understanding land rights, securing tenure, and recognizing how these communities contribute to environmental protection. |
How it’s used: Project developers identify and engage with indigenous and local communities as key partners in project design and implementation. Funders ensure investments in nature-based solutions respect land rights and avoid conflicts, promoting socially responsible finance. Corporates conduct human rights due diligence in supply chains, ensuring ethical sourcing and EUDR compliance.
Source & Access to dataset: LandMark Community and National Level Data Sources; accessible via LandMark Platform, Commonland (overview), Native-Land.ca (related mapping initiative)
Credits:
- Methodology: More information can be found in the LandMark Methodology.
Logging Concessions
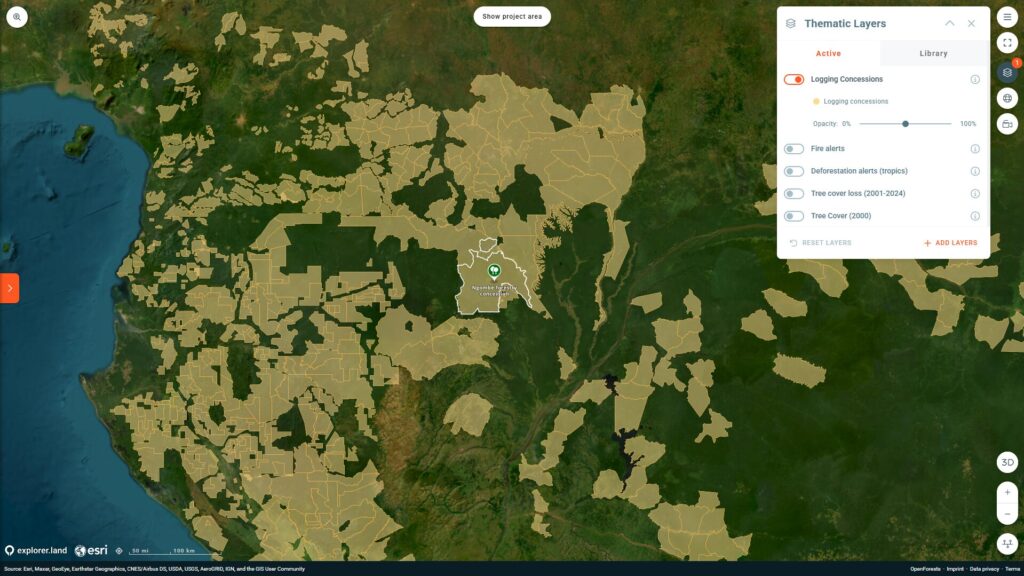
| Key Property | Resolution | Update Frequency | Description |
| Data Details | Varies by country | Varies by country | This layer displays the boundaries of forested areas allocated for timber harvesting by governments to companies. It is crucial for understanding the extent and impact of commercial logging operations. |
How it’s used: Project developers understand existing or planned logging activities that might affect their project area, informing land use planning and stakeholder engagement. Funders assess the risk of logging impacts on forest investments and identify areas where sustainable forestry practices might be supported. Corporates verify that timber products in their supply chains are not sourced from illegal or unsustainable logging concessions, supporting responsible sourcing and EUDR compliance.
Source & Access to dataset: Various national and NGO sources (examples listed in original document); accessible via Global Forest Watch Open Data Portal
Credits:
- Attribution: “Managed forest concessions.” Accessed through Global Forest Watch on 04/11/2024. www.globalforestwatch.org.
Mining Concessions

| Key Property | Resolution | Update Frequency | Description |
| Data Details | Varies by country | Varies by country | This dataset shows areas allocated for mineral extraction. Available for several countries, it’s essential for understanding the footprint of mining activities and their environmental implications. |
How it’s used: Project developers assess the proximity of mining concessions to proposed project sites, understanding potential threats and land use conflicts. Funders identify potential conflicts between mining activities and nature-based solutions investments, informing risk mitigation strategies. Corporates conduct due diligence on mineral sourcing, ensuring their supply chains are not linked to environmentally damaging mining operations, and supporting responsible mineral sourcing.
Source & Access to dataset: Various national and NGO sources (examples listed in original document); accessible via Global Forest Watch Open Data Portal (search for “mining concessions”)
Credits:
- Attribution: “Mining concessions.” Accessed through Global Forest Watch on 04/11/2024. www.globalforestwatch.org.
Conclusion and Outlook
The thematic data layers integrated into explorer.land are fundamental to effectively plan, execute, and transparently monitor nature-based projects. These precise and comprehensive datasets, derived from advanced satellite imagery and sophisticated analytical models, offer an unparalleled window into Earth’s dynamic systems. They are actively used by project developers for baseline assessments and intervention planning, by funders and investors for risk assessment and impact optimization, and by corporates for transparent monitoring, due diligence, EUDR compliance, and evidence-based storytelling.
A key strength of explorer.land is that these thematic data layers are integrated into the platform by default, providing a centralized and accessible resource for all stakeholders and with this democratizing access to geospatial data. The seamless integration ensures that users have immediate access to critical environmental intelligence without needing to acquire and process data independently. We are continuously expanding this library by integrating more data layers to ensuring that explorer.land remains at the forefront of providing the most current and relevant information for global environmental stewardship. Our commitment is to continually enrich the platform’s capacity to support informed decision-making and verifiable impact documentation in the vital work of healing and protecting our natural world.
The Power of Integrated Thematic Data Layers for Restoration
These thematic data layers, individually powerful, become even more impactful when integrated. They allow for a holistic understanding of complex environmental issues, enabling more informed decision-making for sustainable development, climate action, and biodiversity conservation. For investors and funders of nature-based solutions, project developers analyzing potential sites, and corporates ensuring transparent impact monitoring and EUDR compliance, these datasets on explorer.land and home.explorer.land are indispensable. By continuously monitoring our planet with such precision, we can better protect its invaluable resources for future generations.
Stay curious, stay informed, and support the initiatives that make this incredible data available to all! For more information or to explore the platform, visit explorer.land.